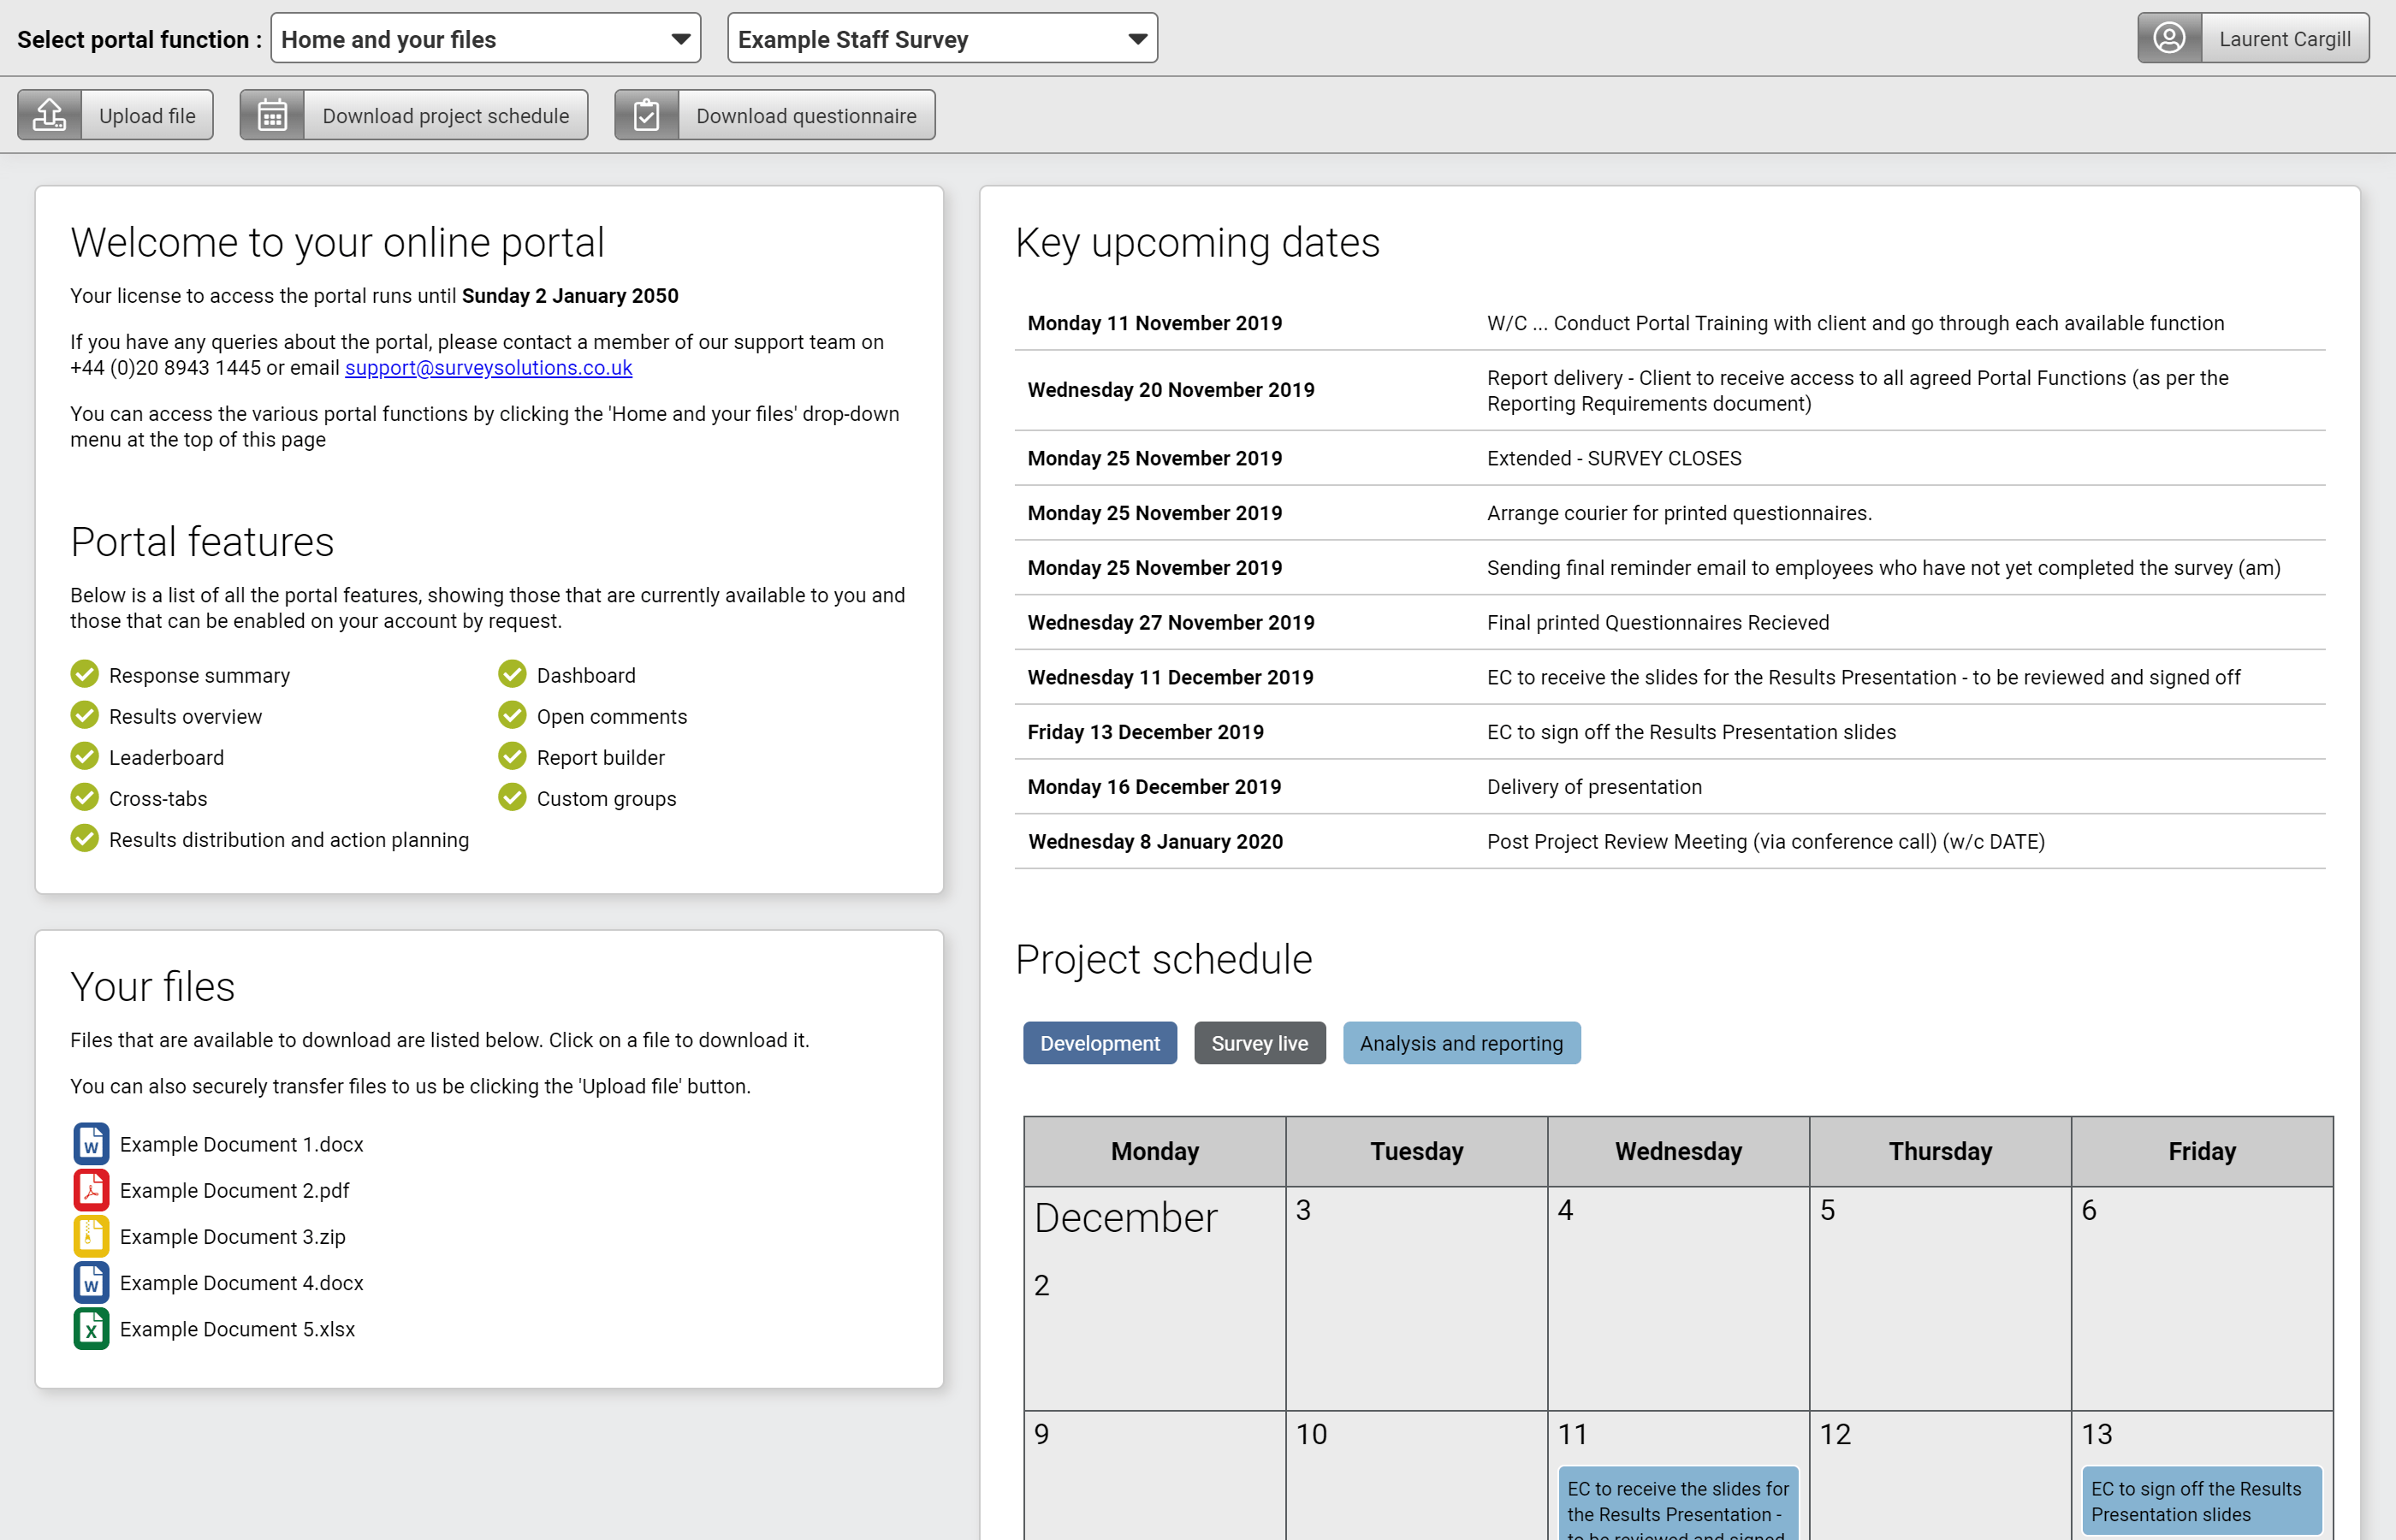
Home page
This central hub provides you with key information about your project, allowing you to review the project schedule and transfer files securely
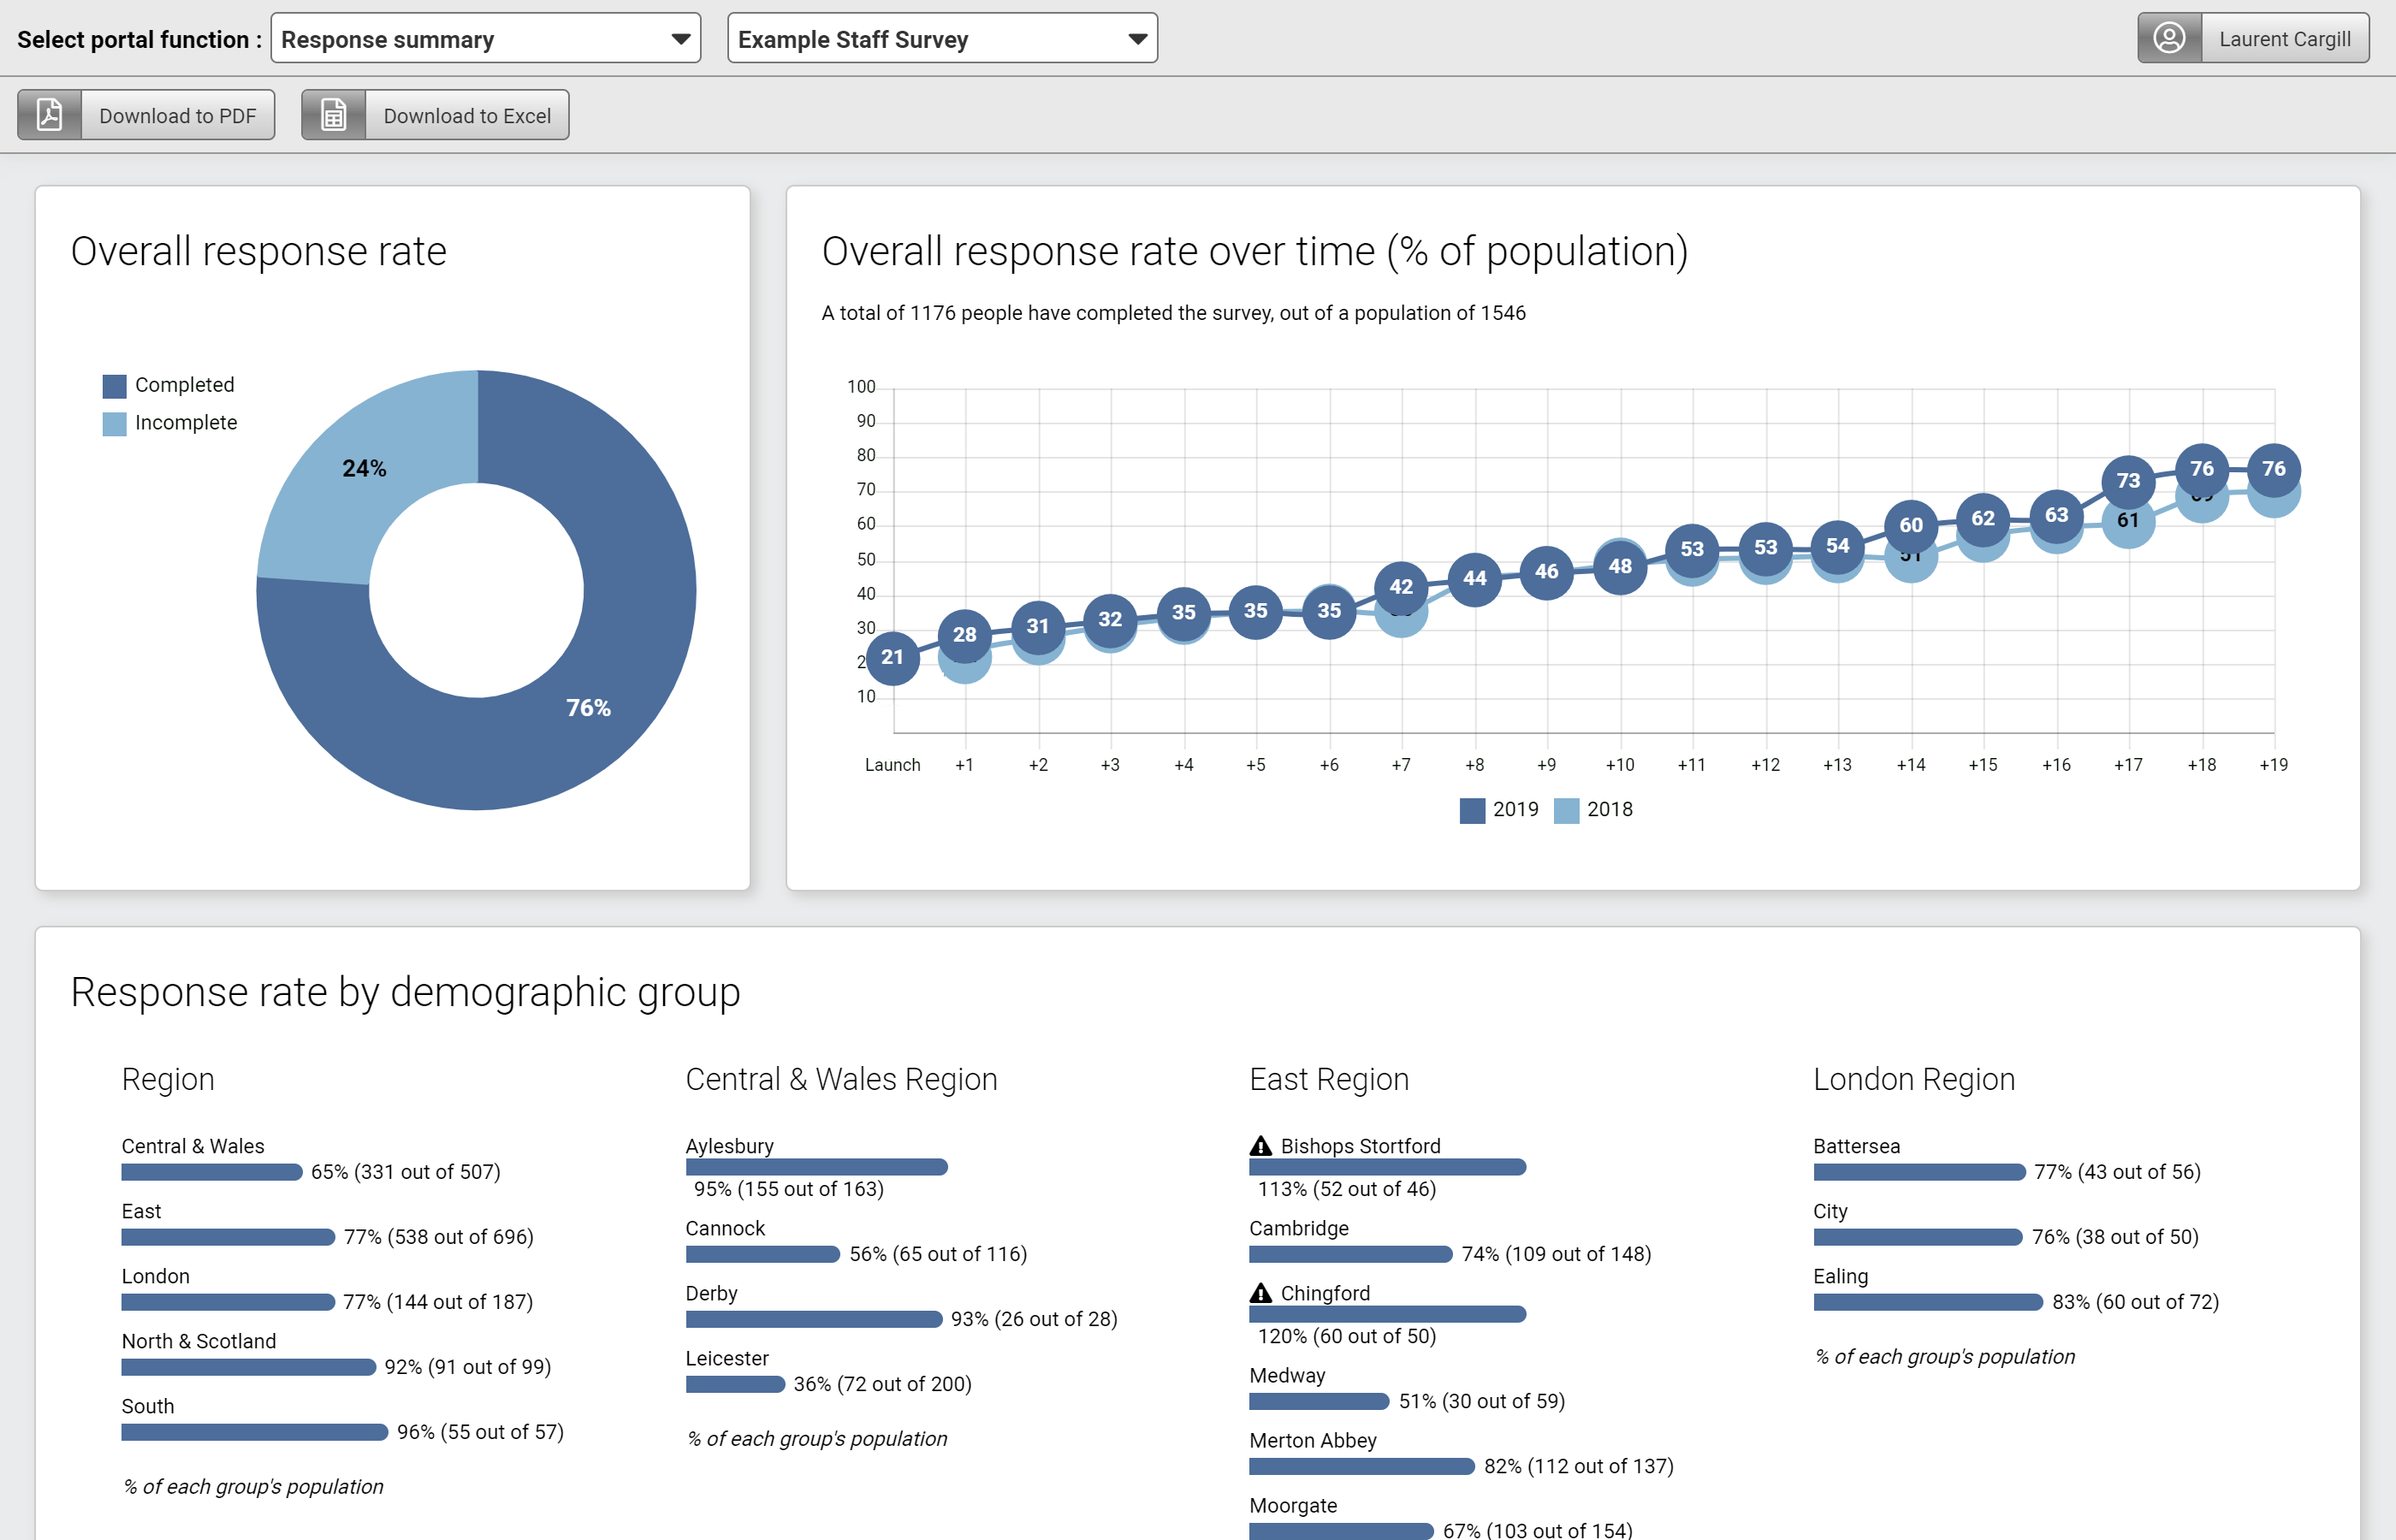
Response summaries
During the survey live period ‘Response summaries’ allows you to monitor the live completion rates for all key demographic groups included in your survey.
Response rates can be exported into excel or PDF to help encourage participation and healthy competition between departments.
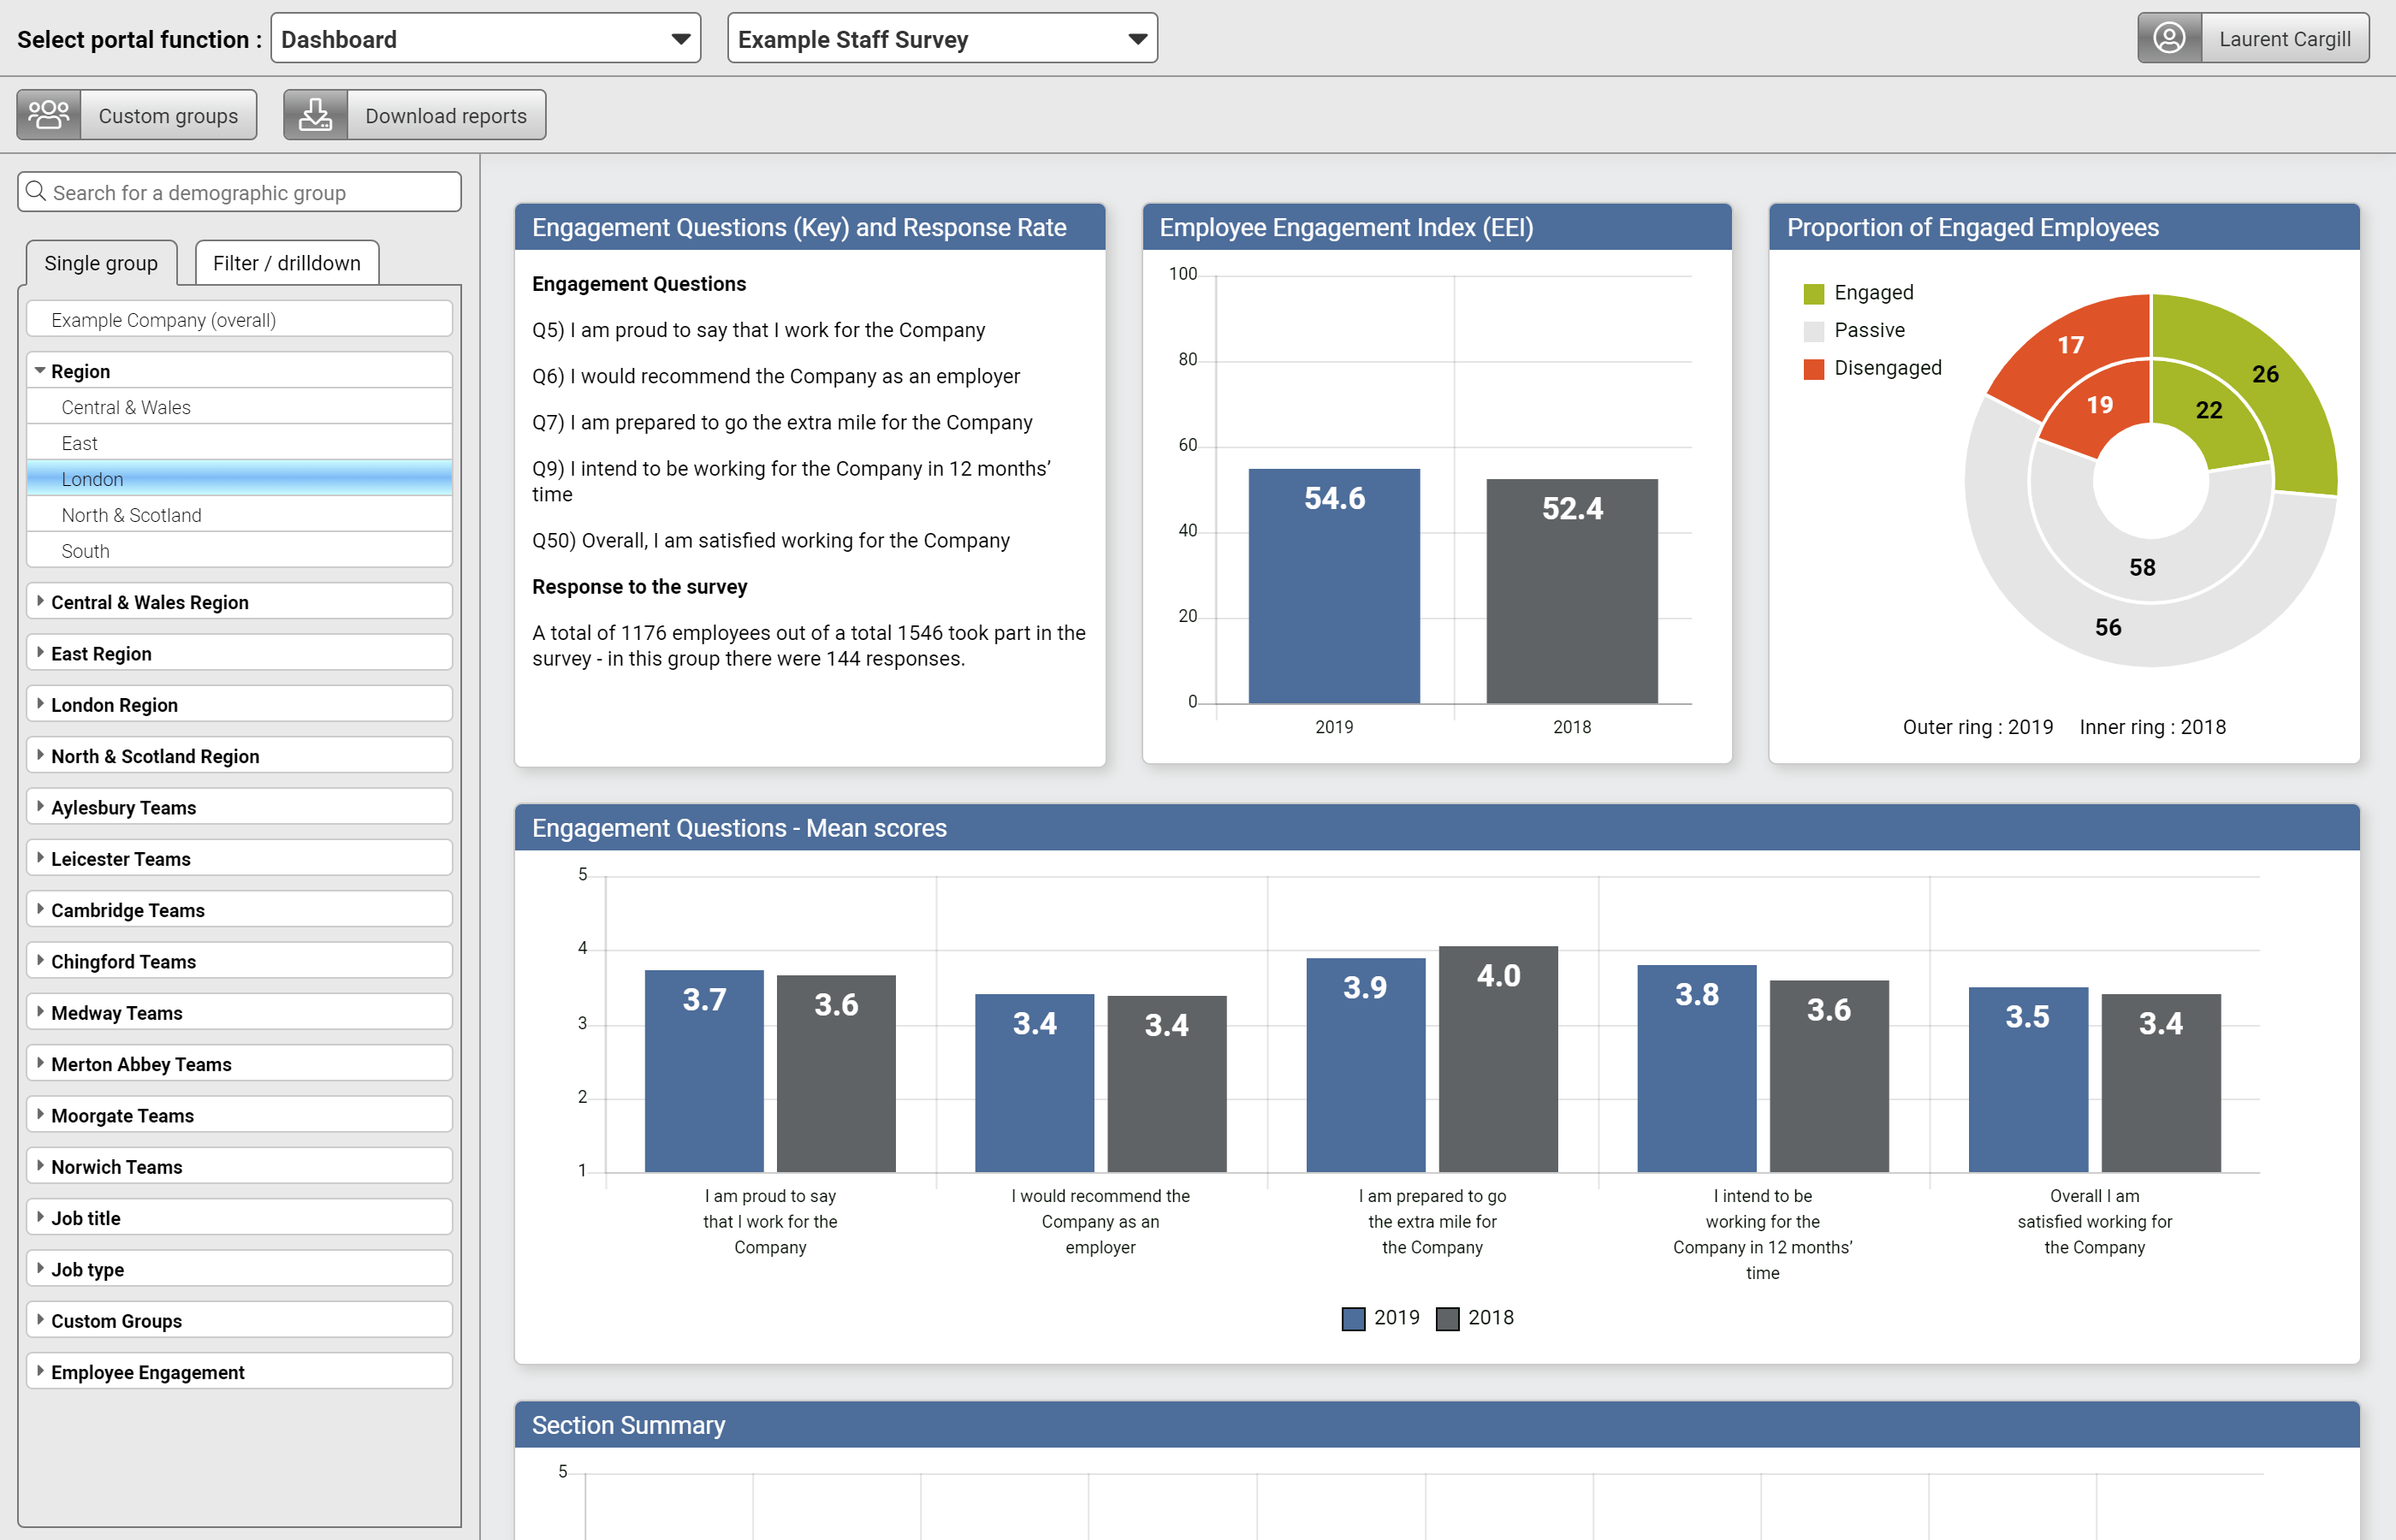
Dashboard report
This report is a great way to communicate the survey results to Senior Managers and Managers as it shows the key measures at a glance.
We would work with you to identify the measures to be shown and create a template tailored for you.
The dynamic template can be used to report and download the key results for any demographic group.
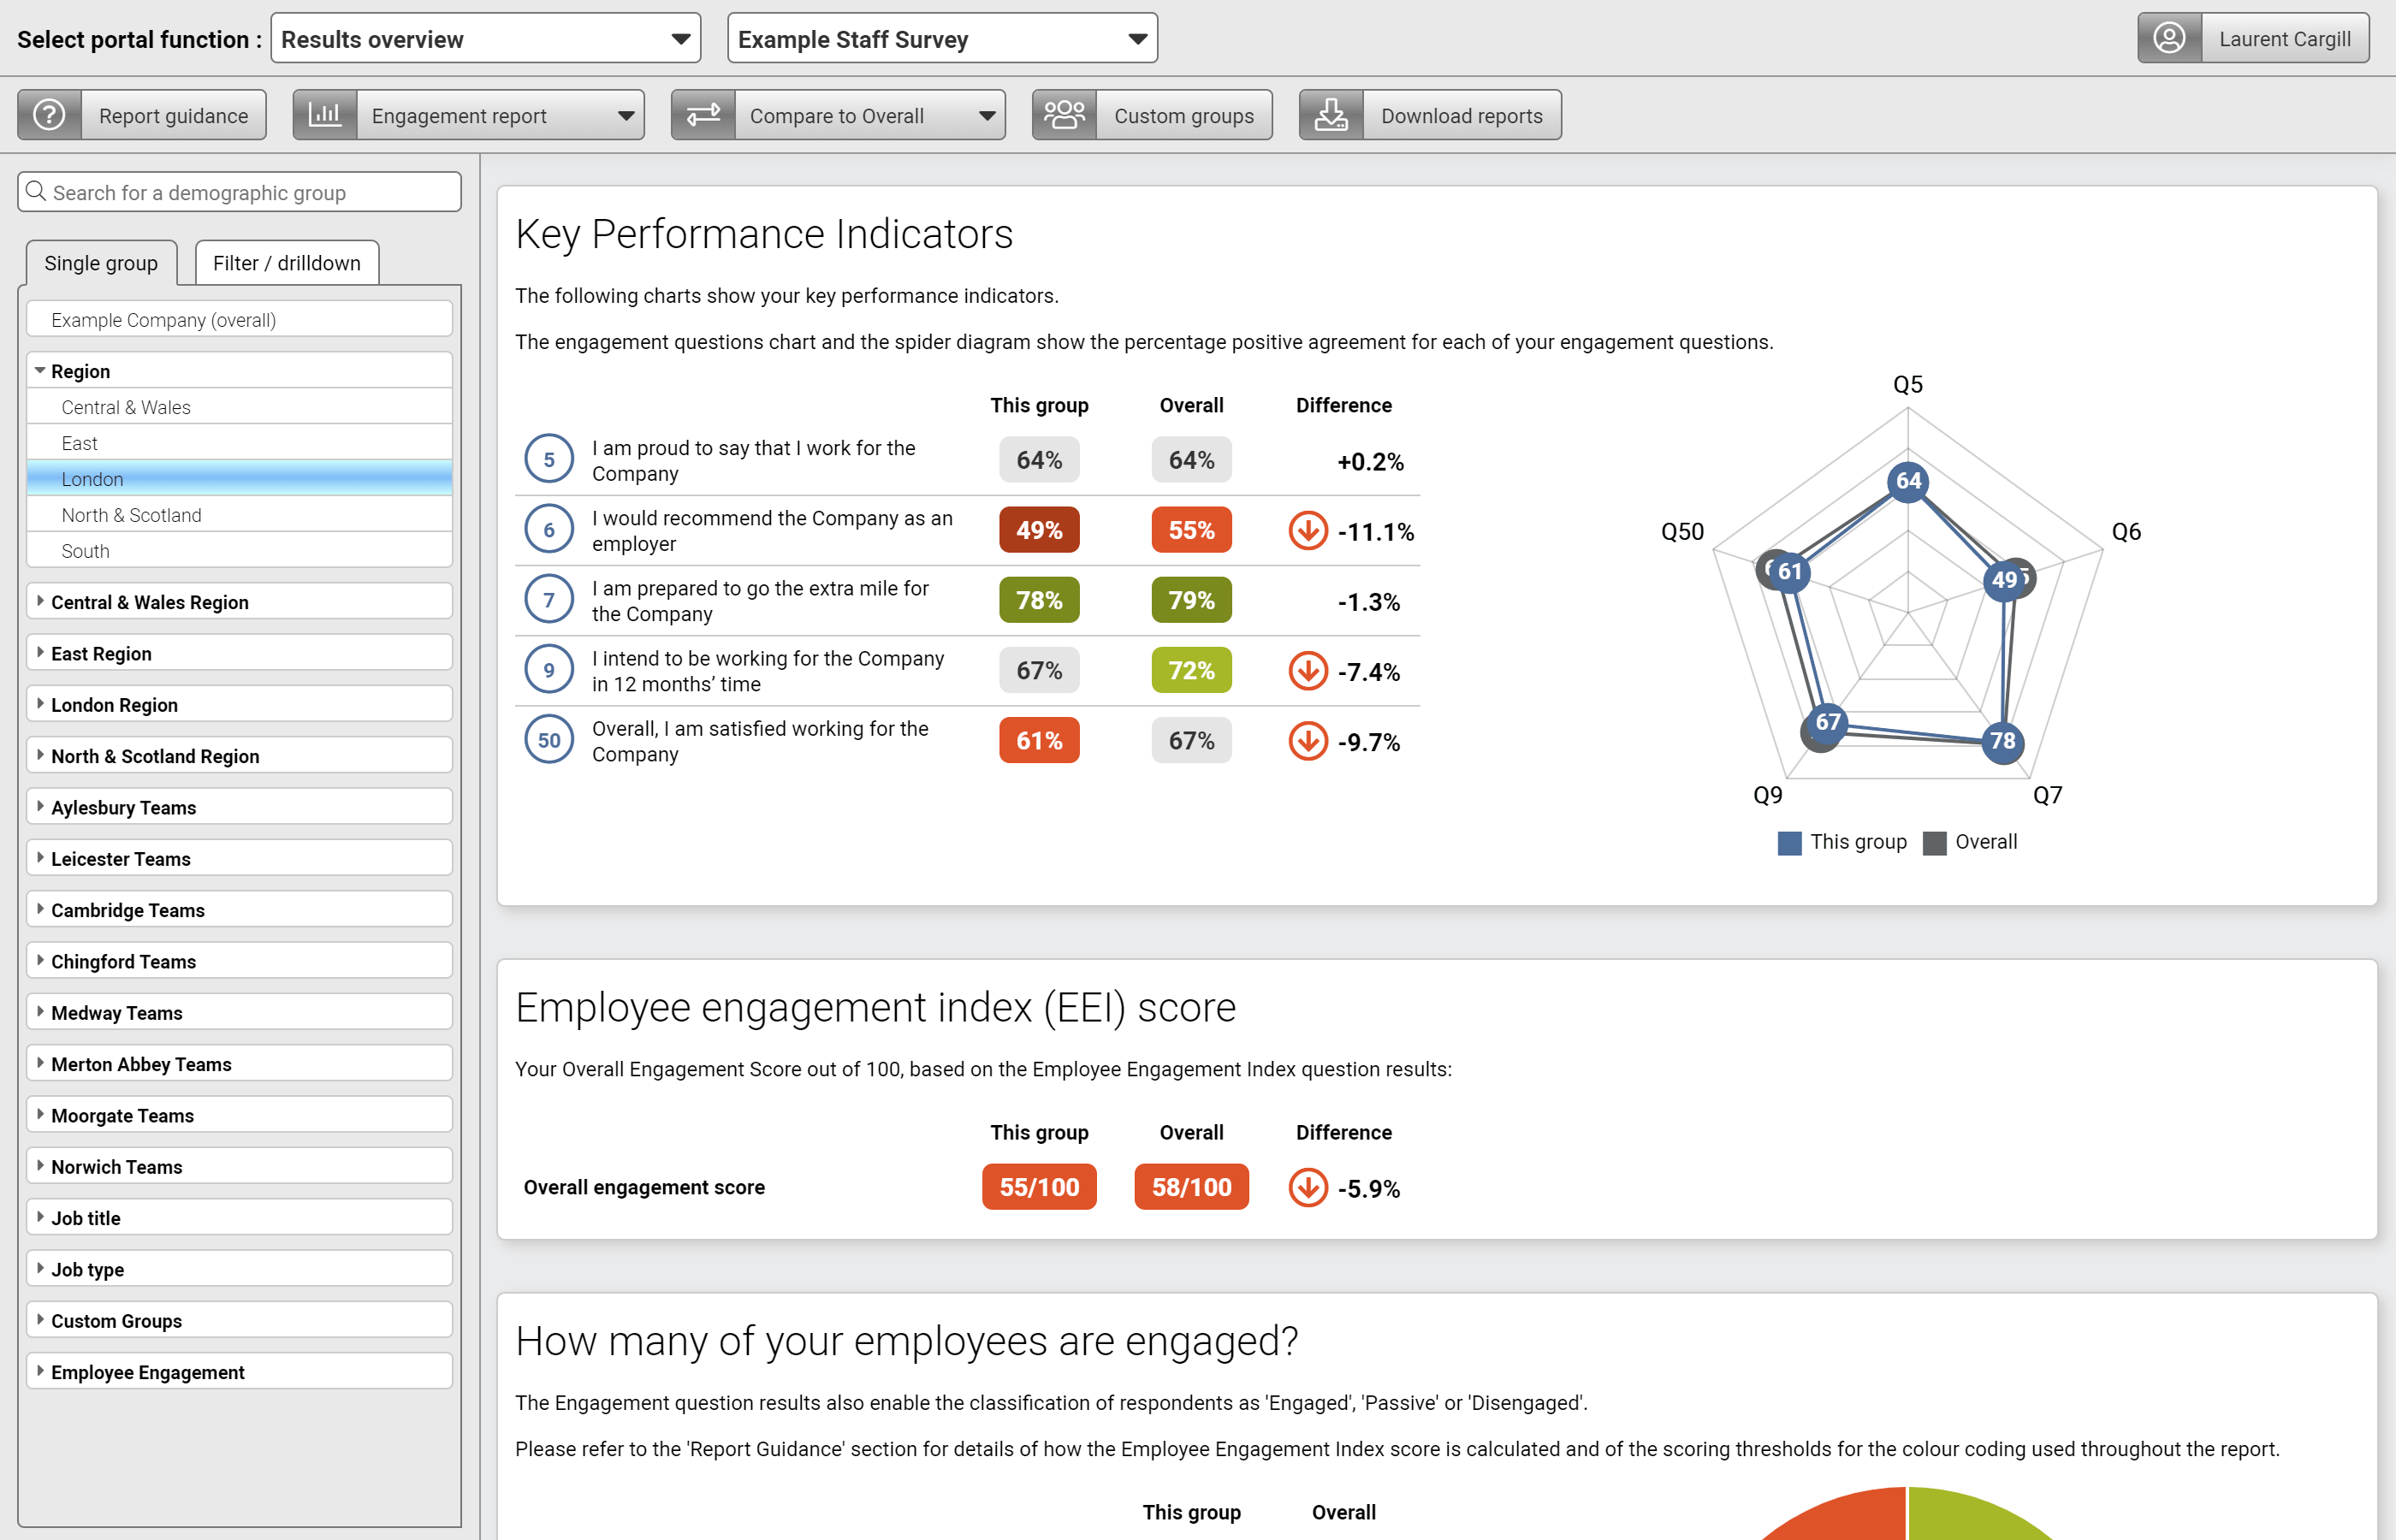
Key performance indicators report
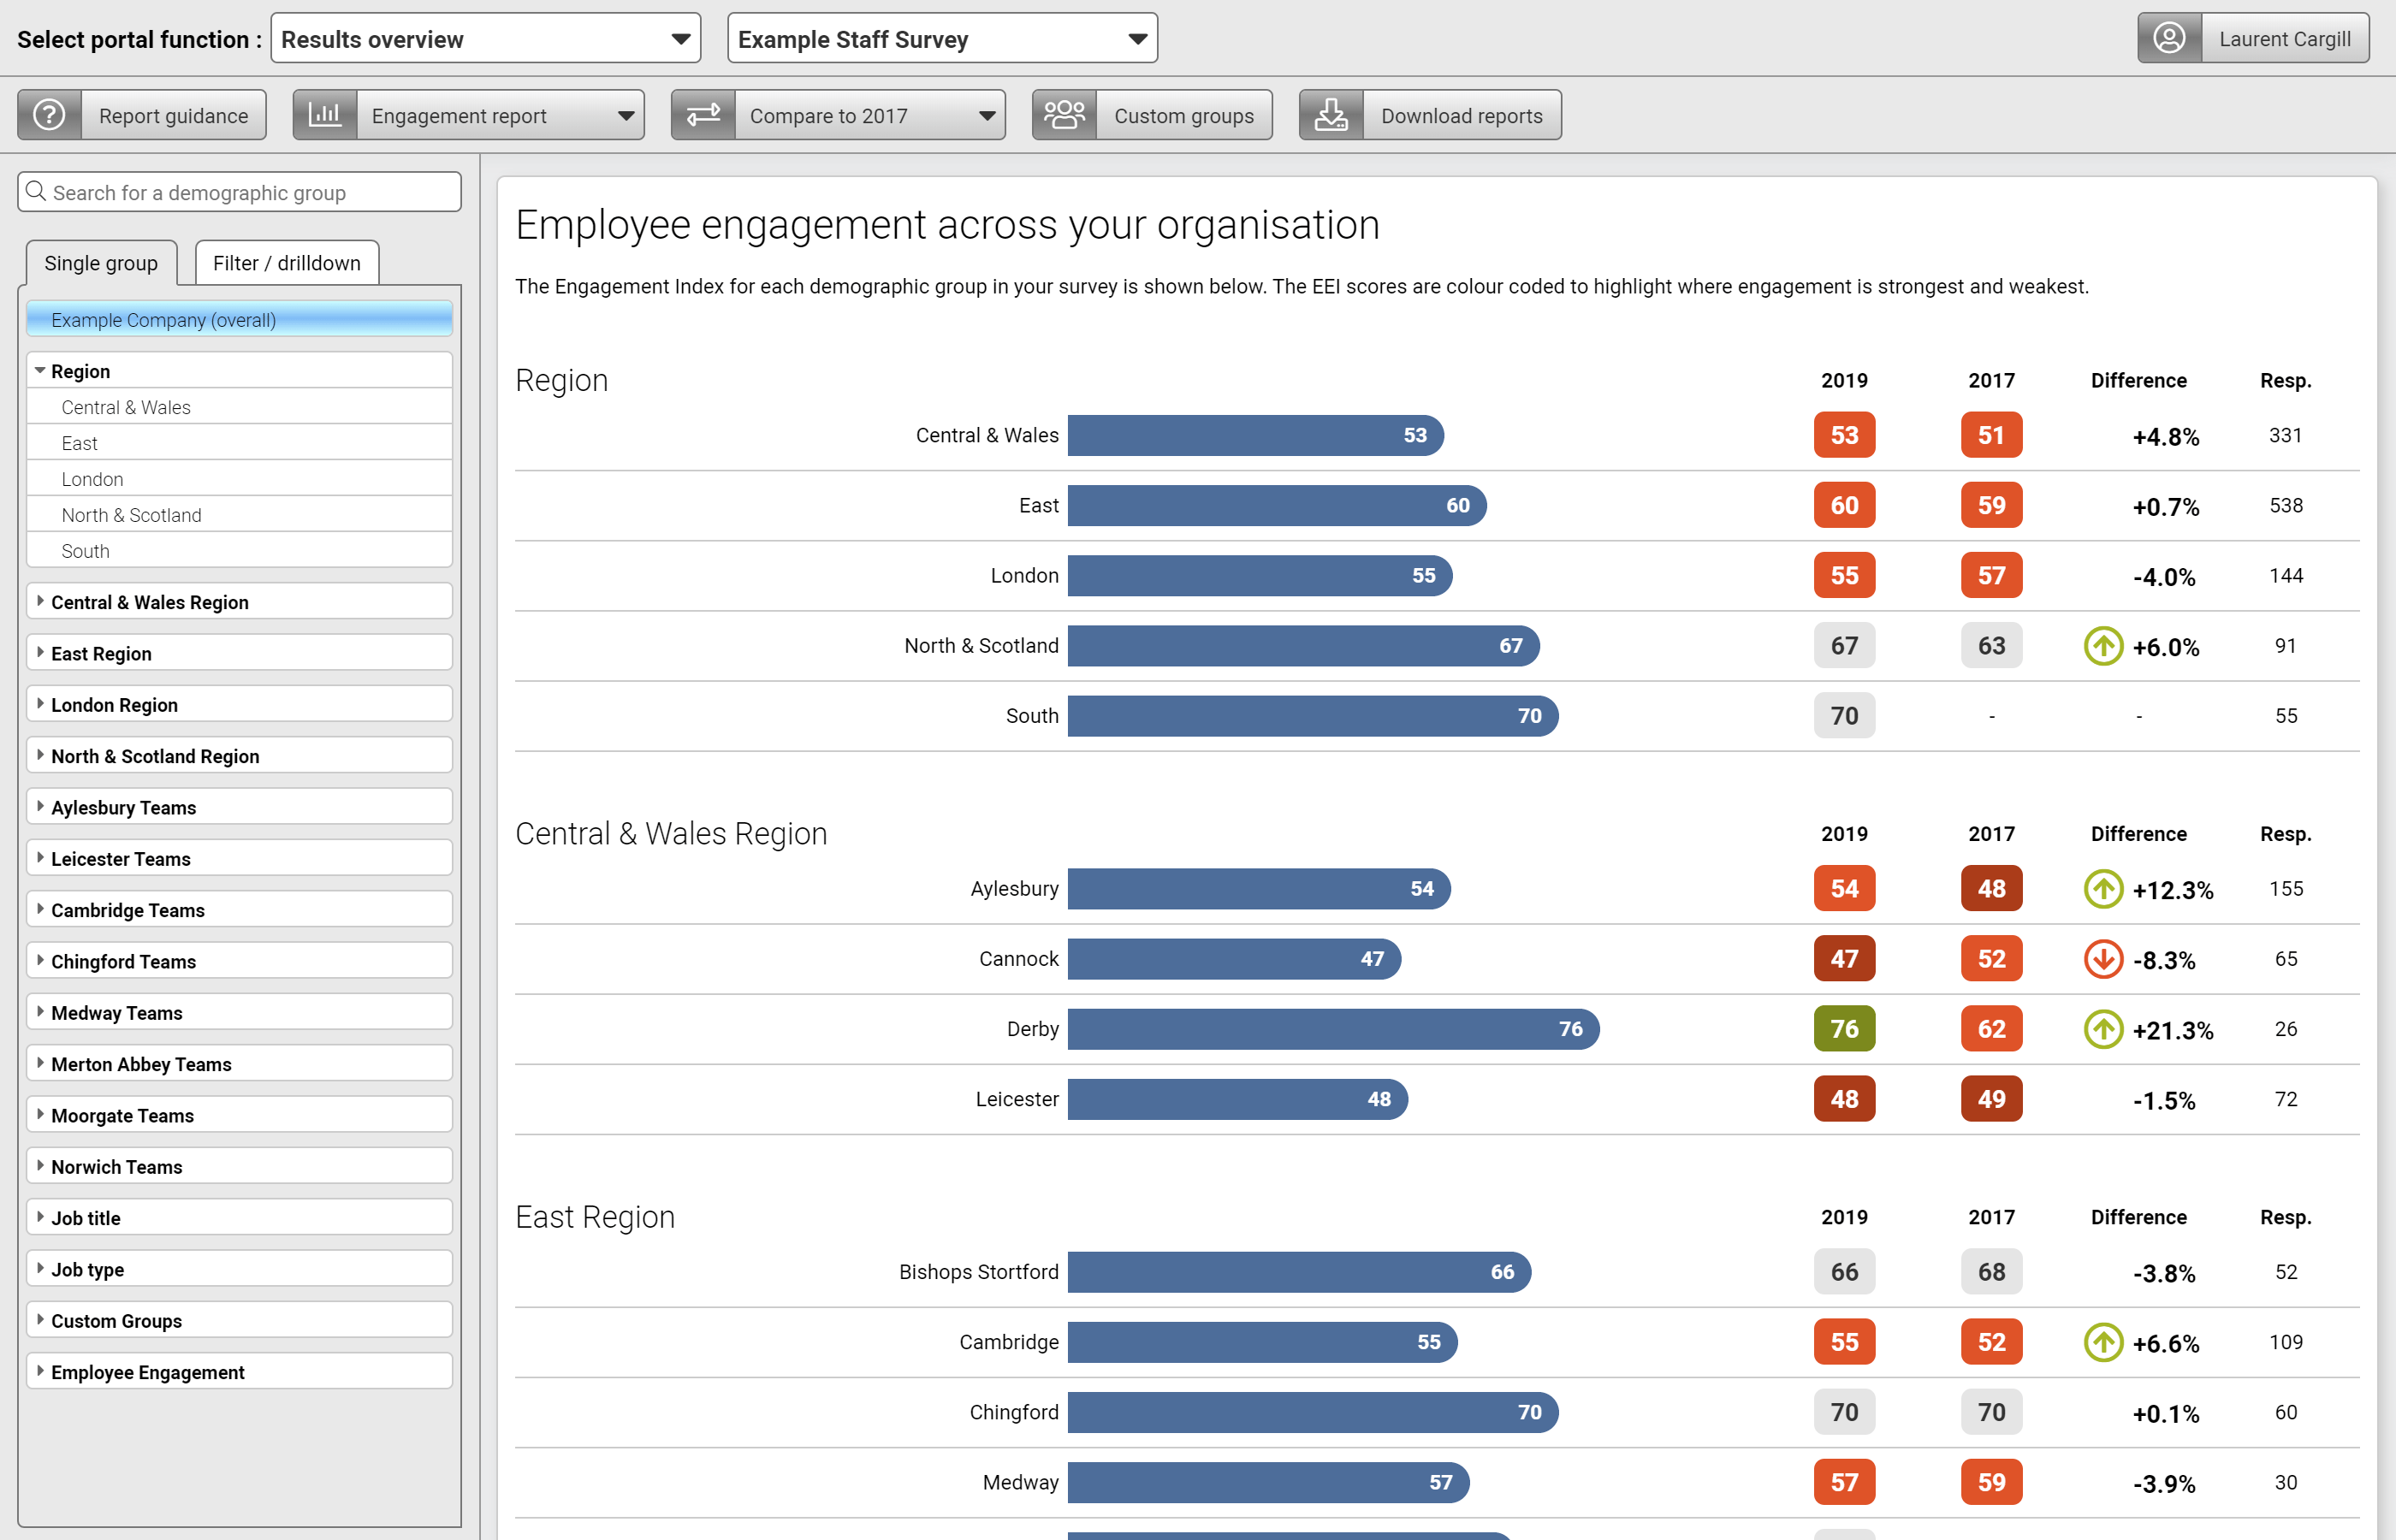
‘Results overview’ provides a comprehensive and visually rich set of pre-created and ready-to-use reports showing the results from your survey.
The 'Engaged report' provides insight into employee engagement across your organisation
Key performance indicators report
‘Results overview’ provides a comprehensive and visually rich set of pre-created and ready-to-use reports showing the results from your survey.
The 'Engaged report' provides insight into employee engagement across your organisation
Summary report
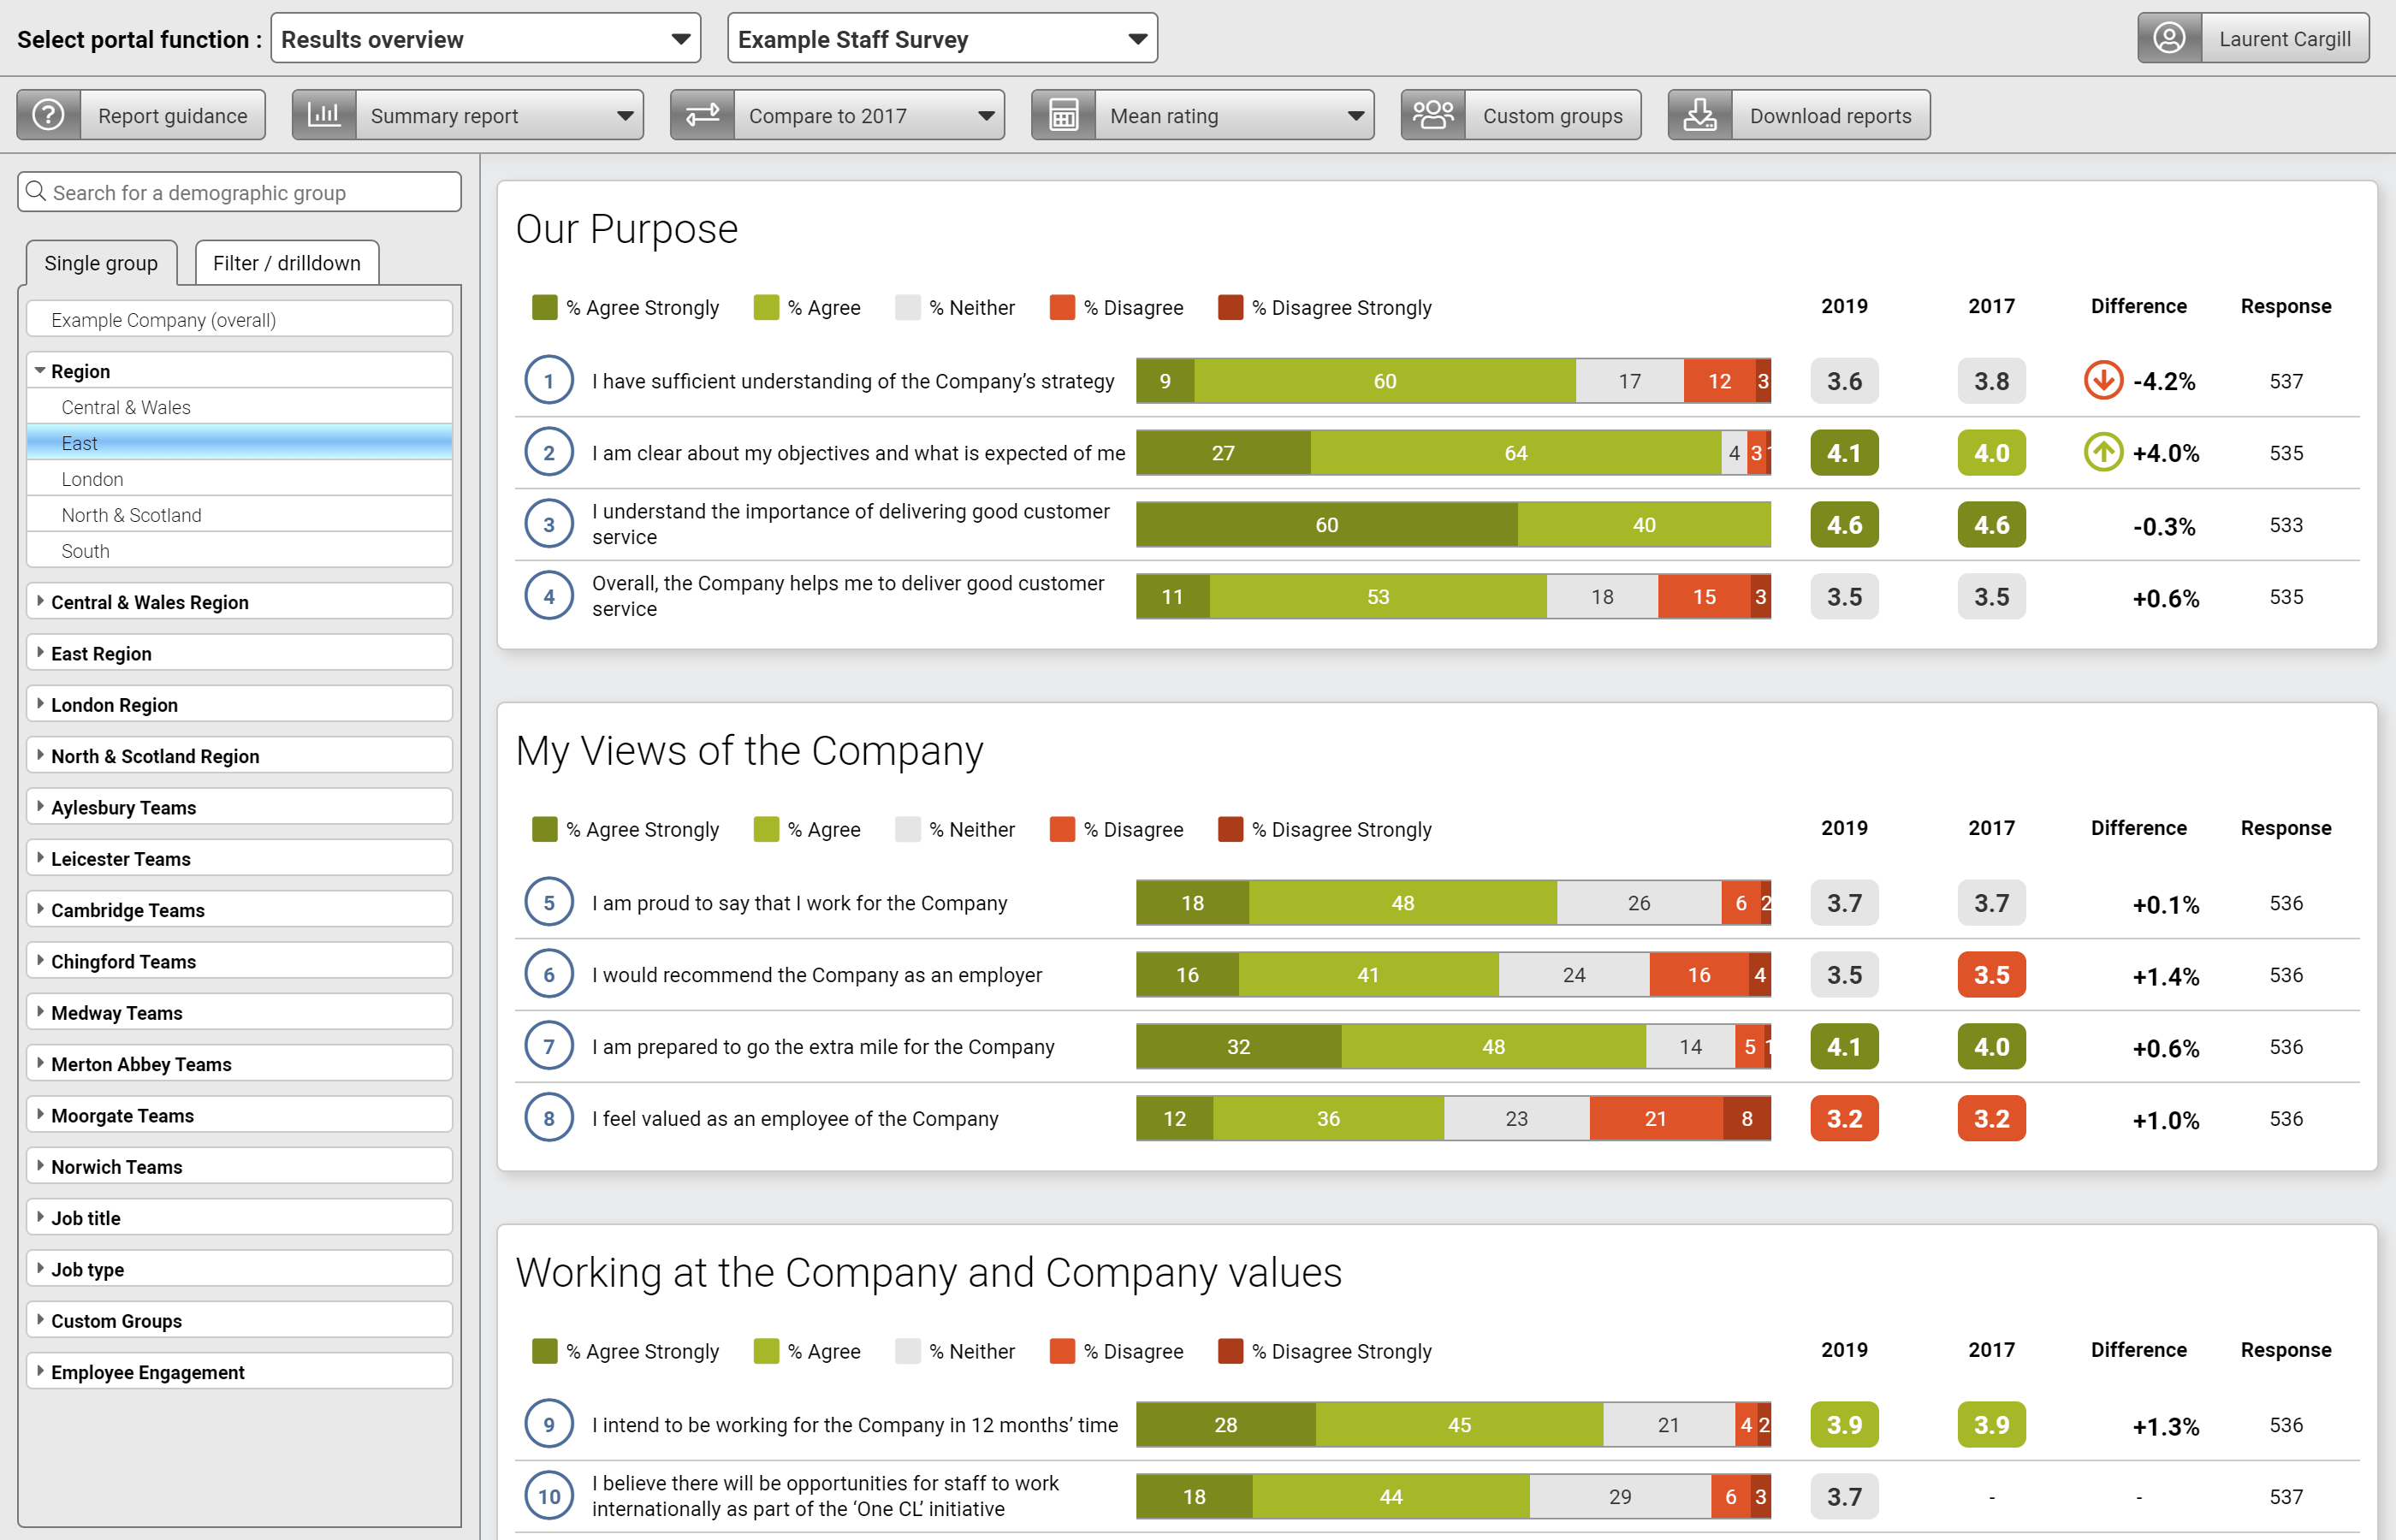
The 'Summary report' shows the results for all questions in the survey, and can be filtered by specified demographic groups.
The results can be compared against the overall results, or if available, the results from a previous year’s survey.
Ranked report
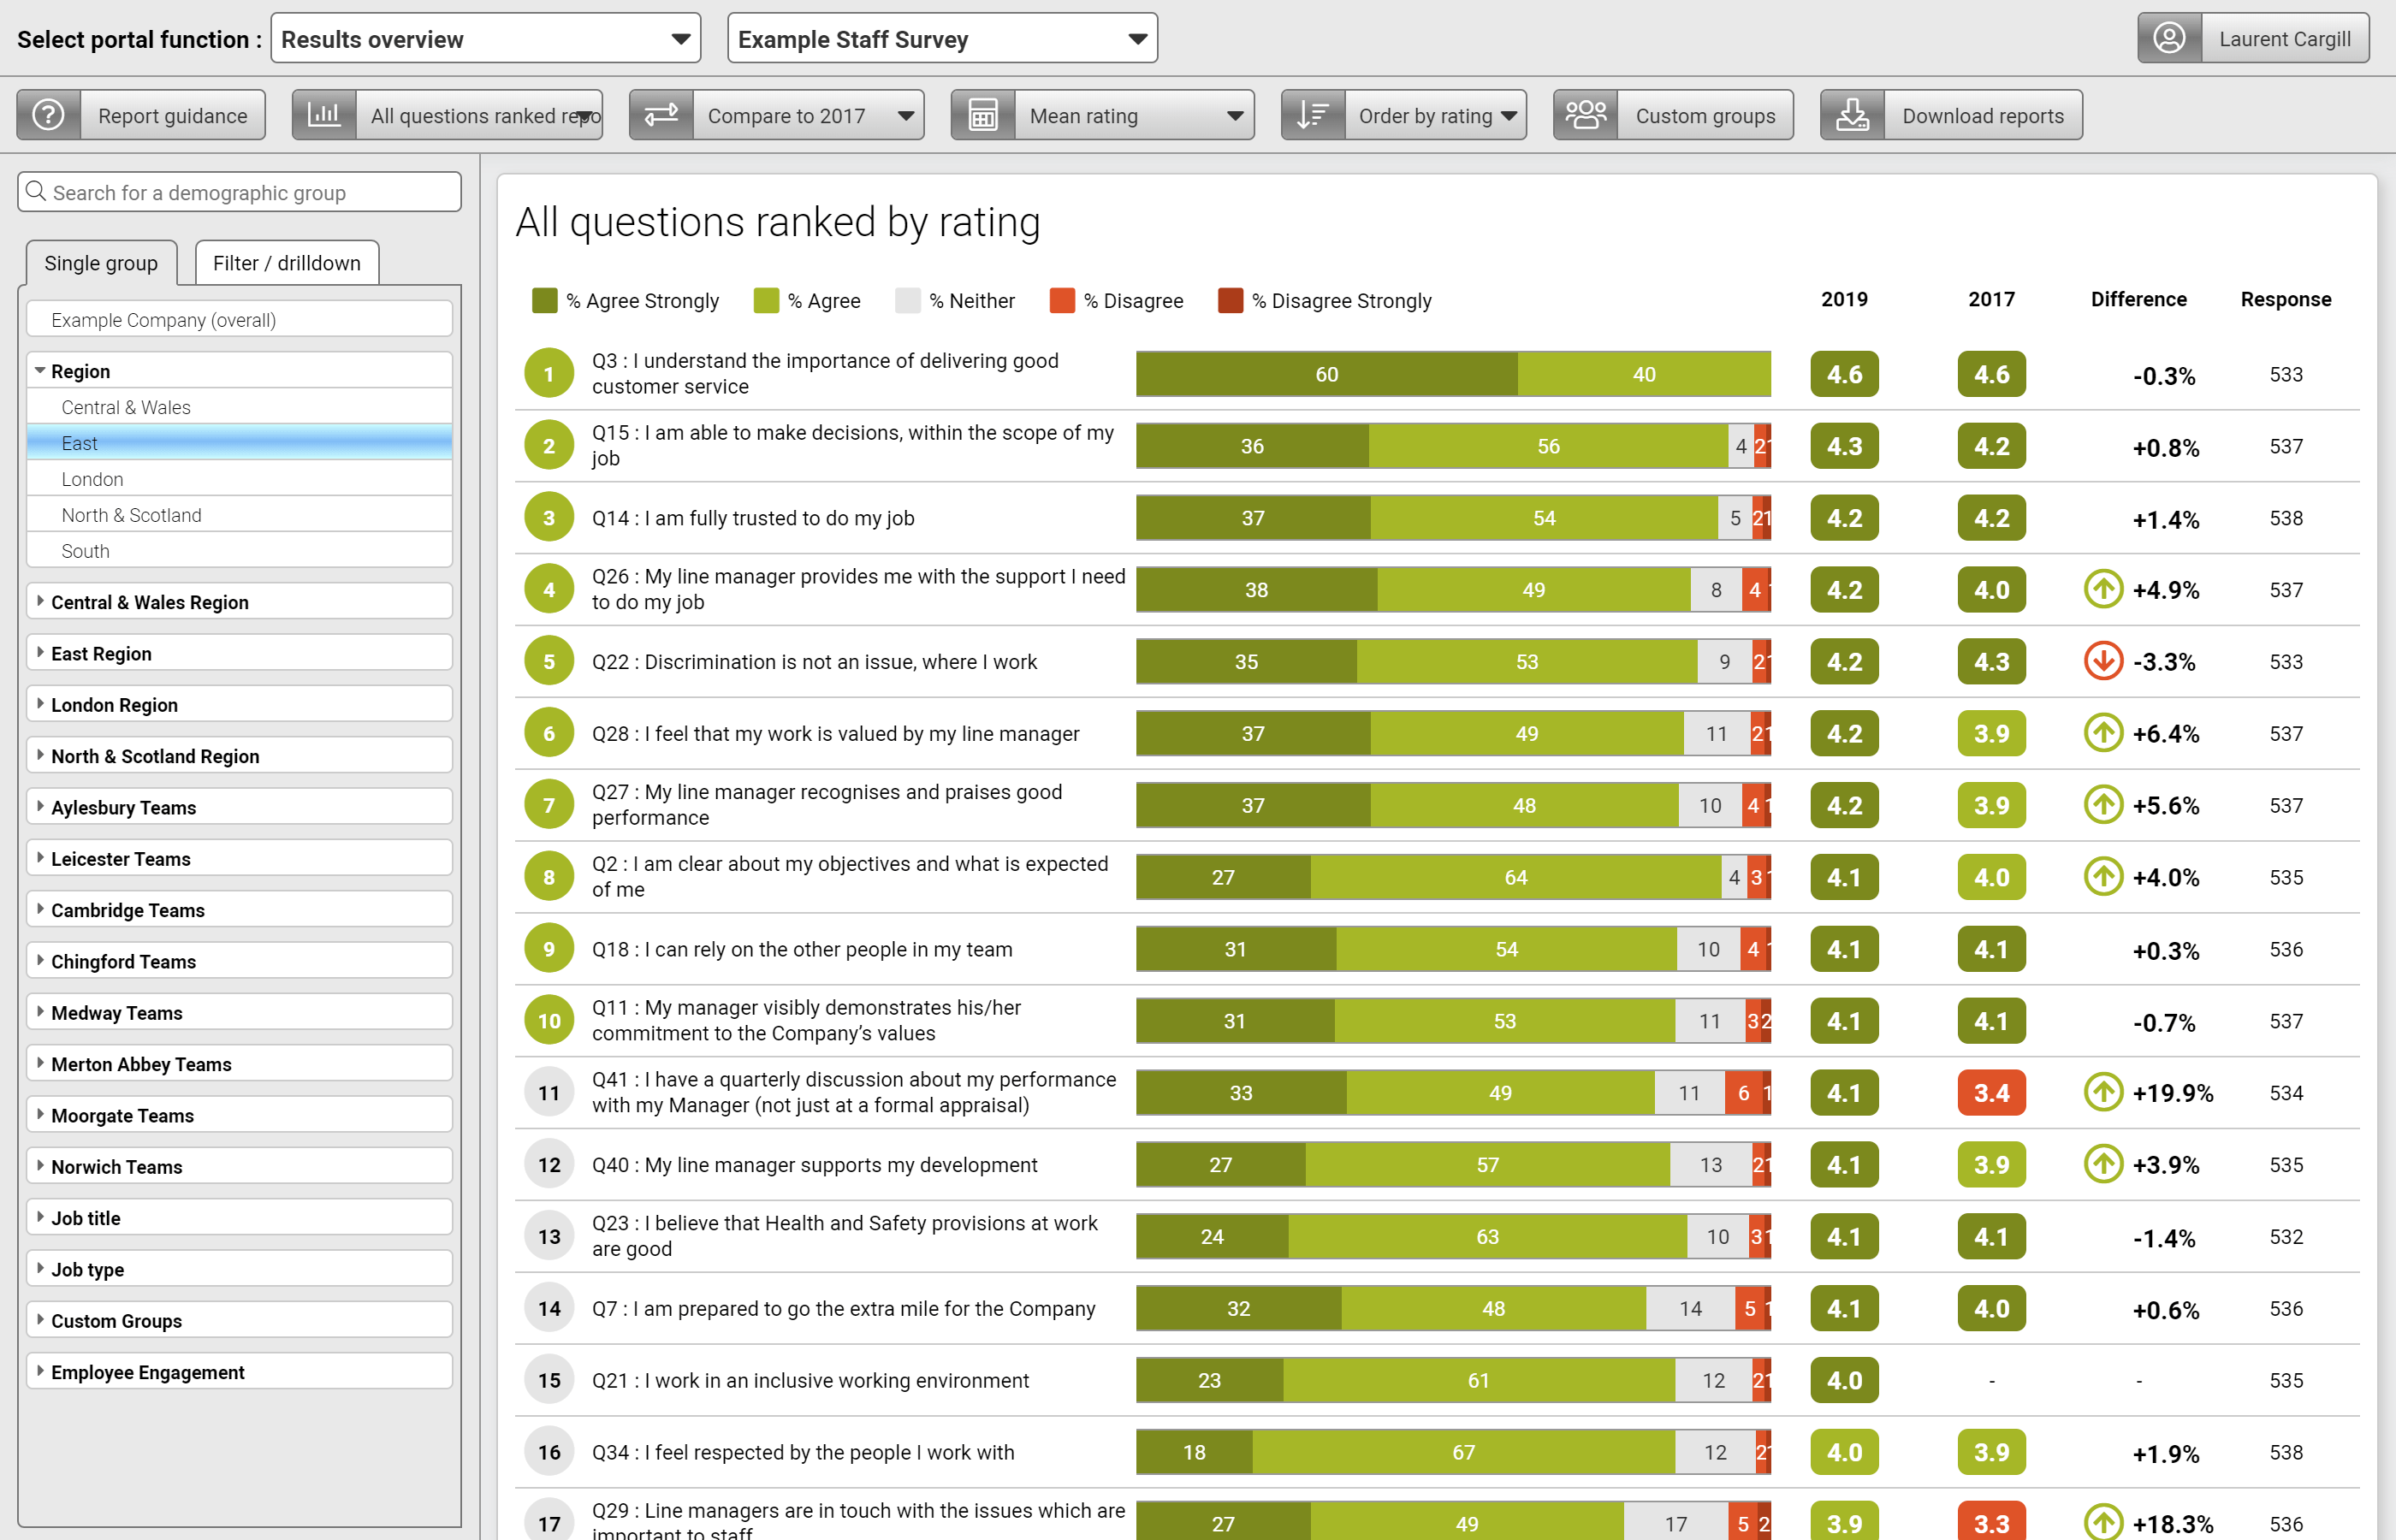
See all questions for a particular group within your organisation ranked by performance.
Discover key variances and areas of strength and weakness.
Key driver report
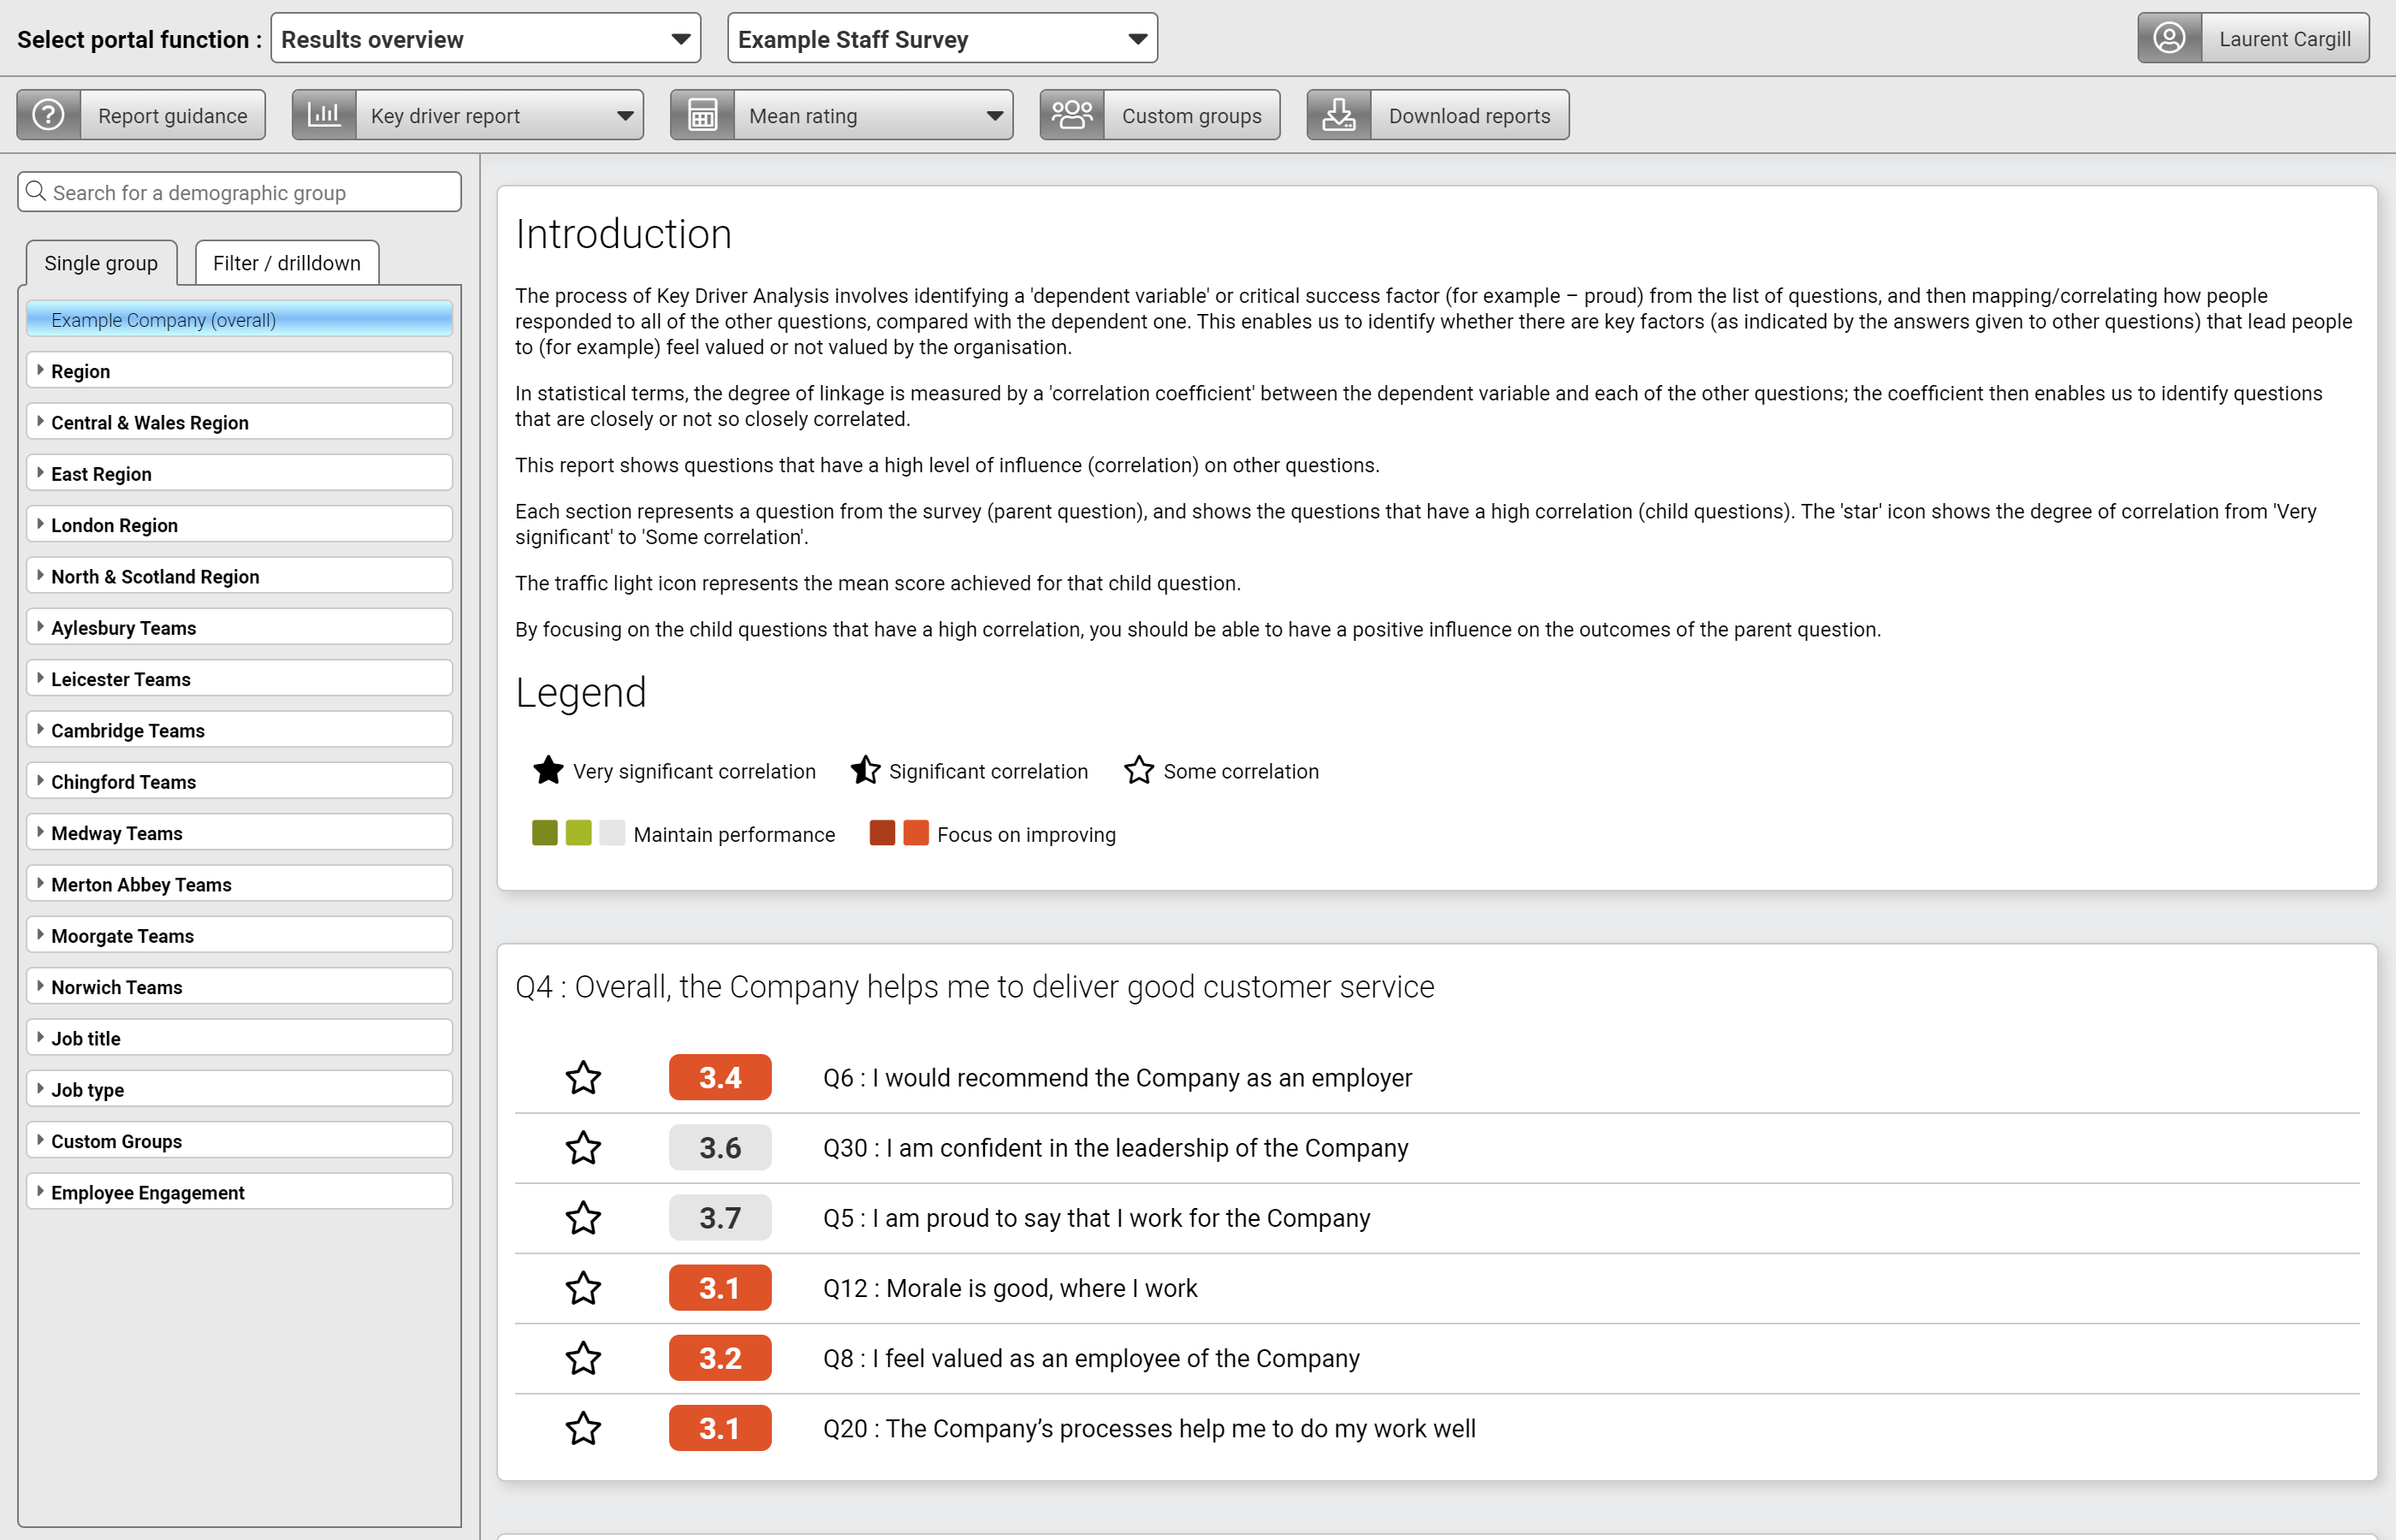
Correlation analysis allows us to highlight questions with a strong relationship.
The allows you to focus your efforts on the areas that are most likely to result in positive outcomes.
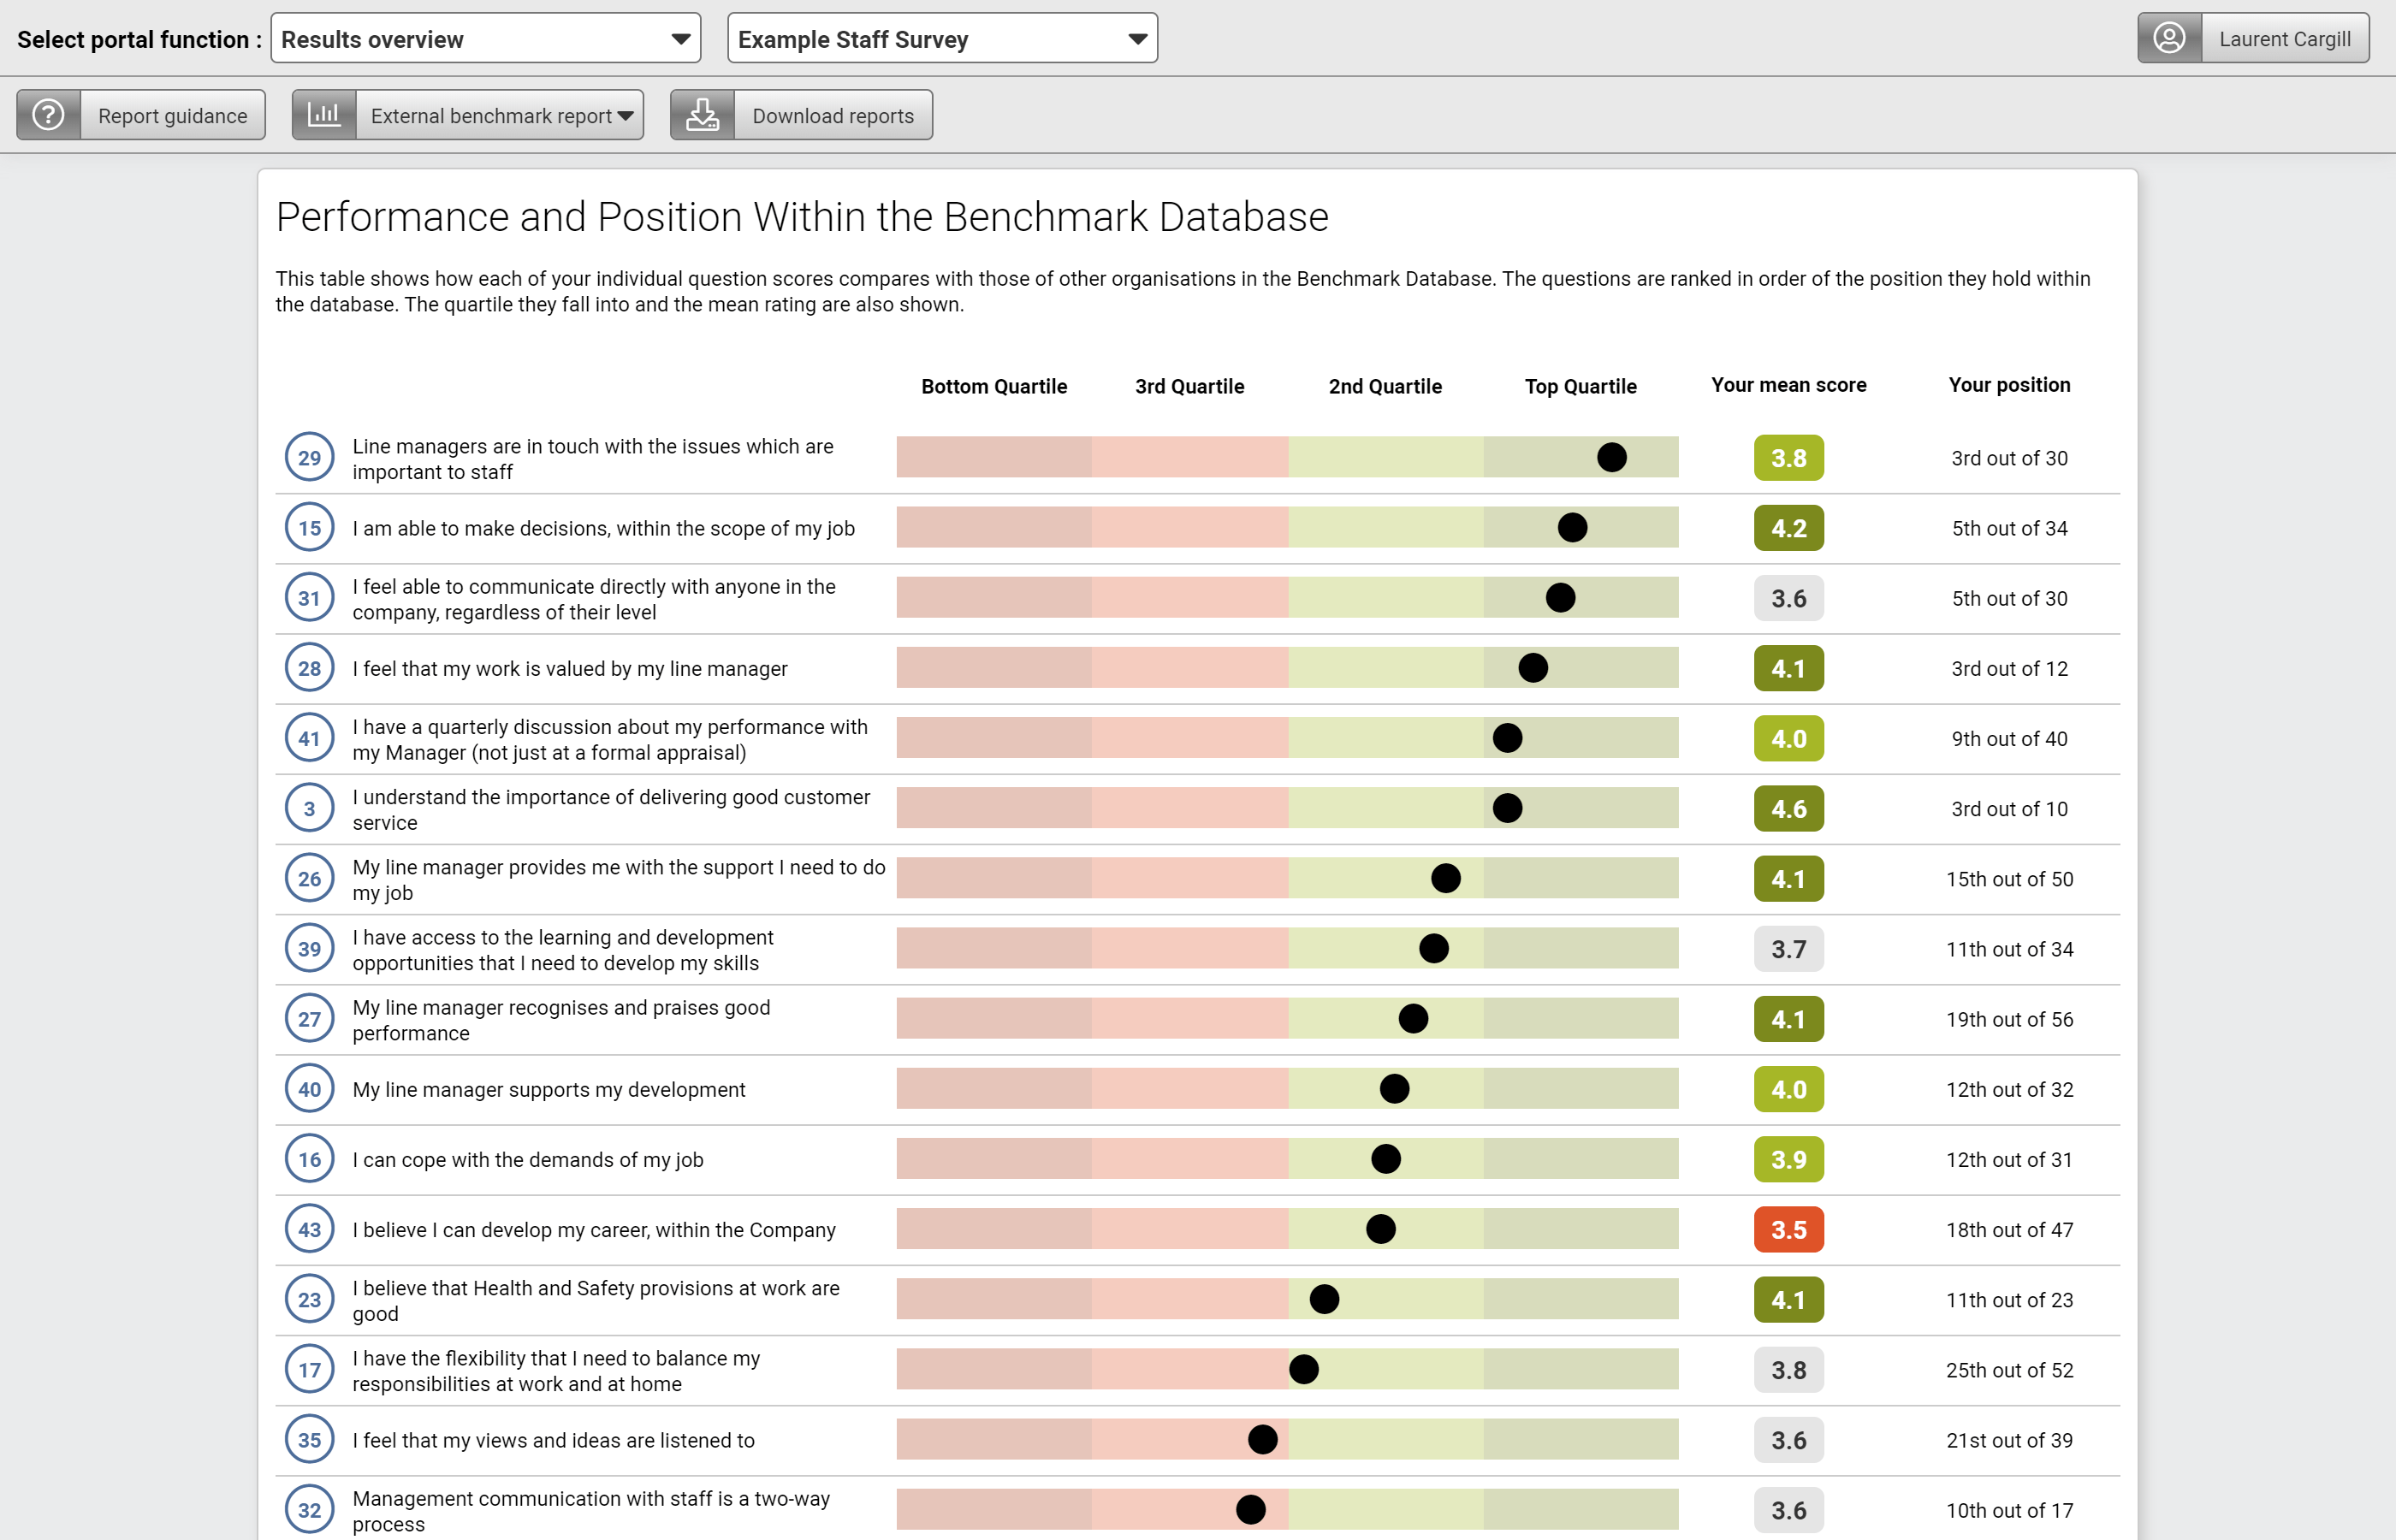
Benchmark report
See how your organisation compares against our benchmark database of comparable organisations
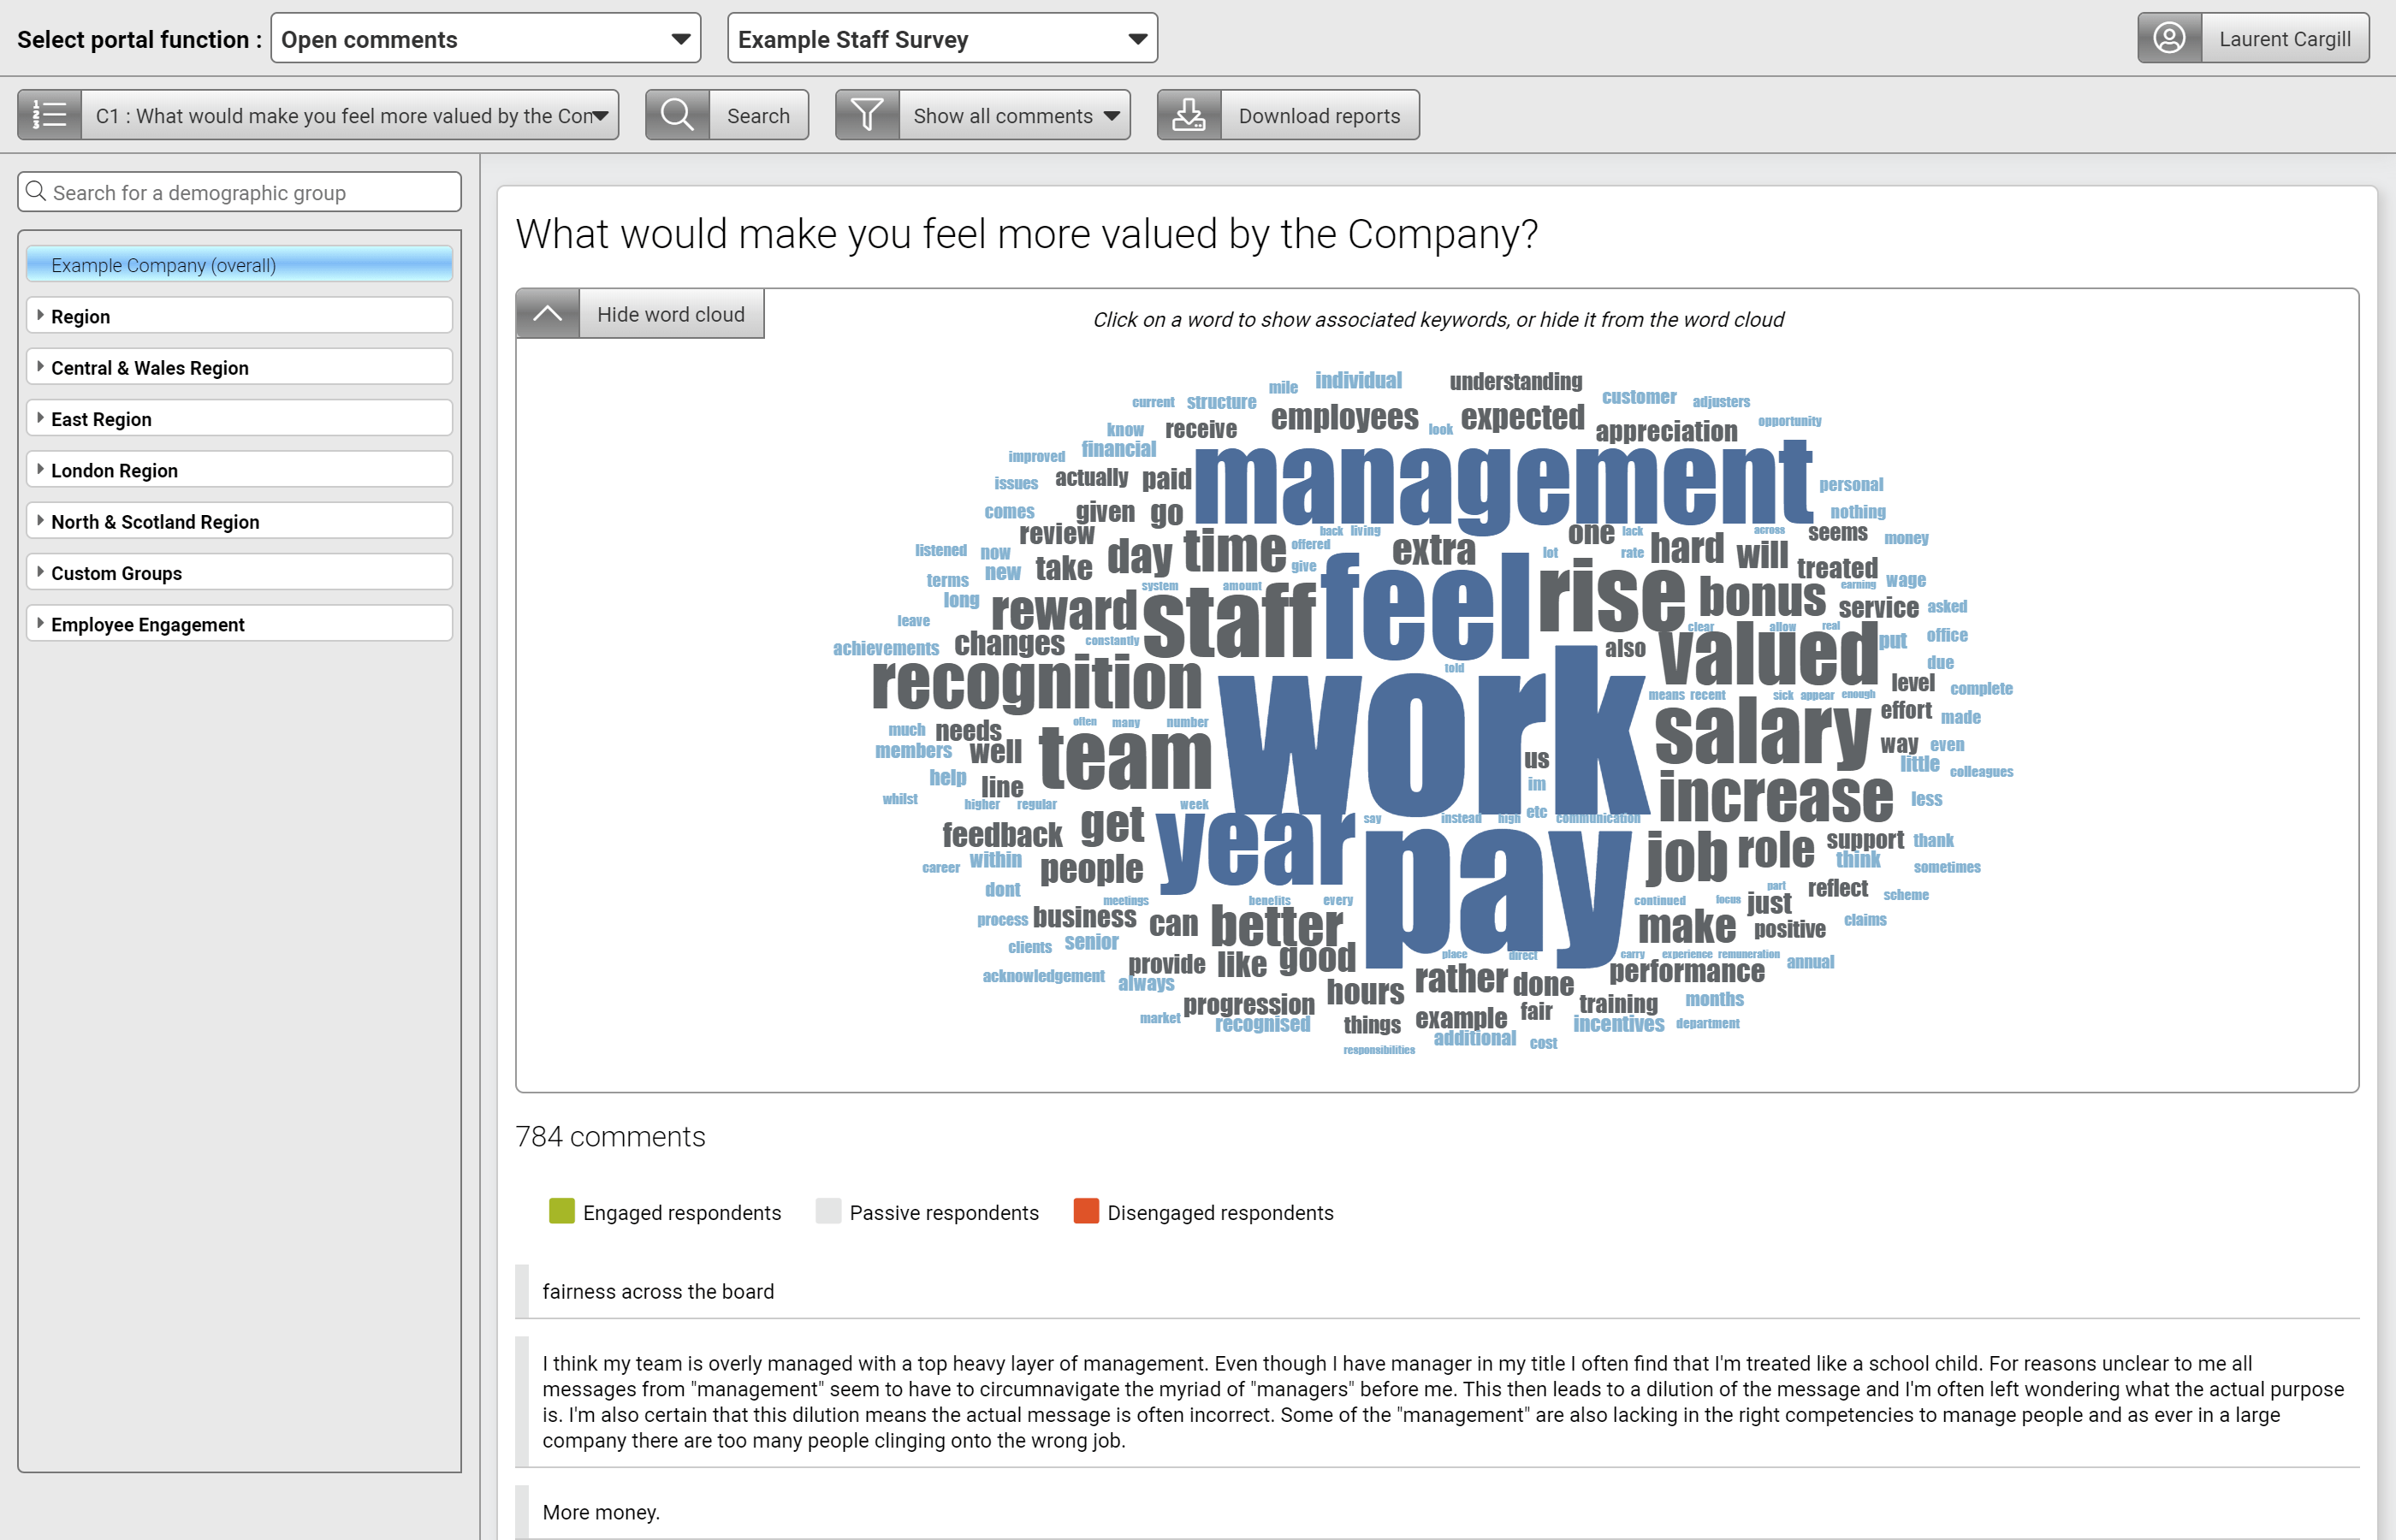
Open comments analysis
‘Open comments’ allows you to view and classify any verbatim comments collected in your survey.
You can perform searches for specific words or phrases, and filter the comments to show only those for specific demographic groups.
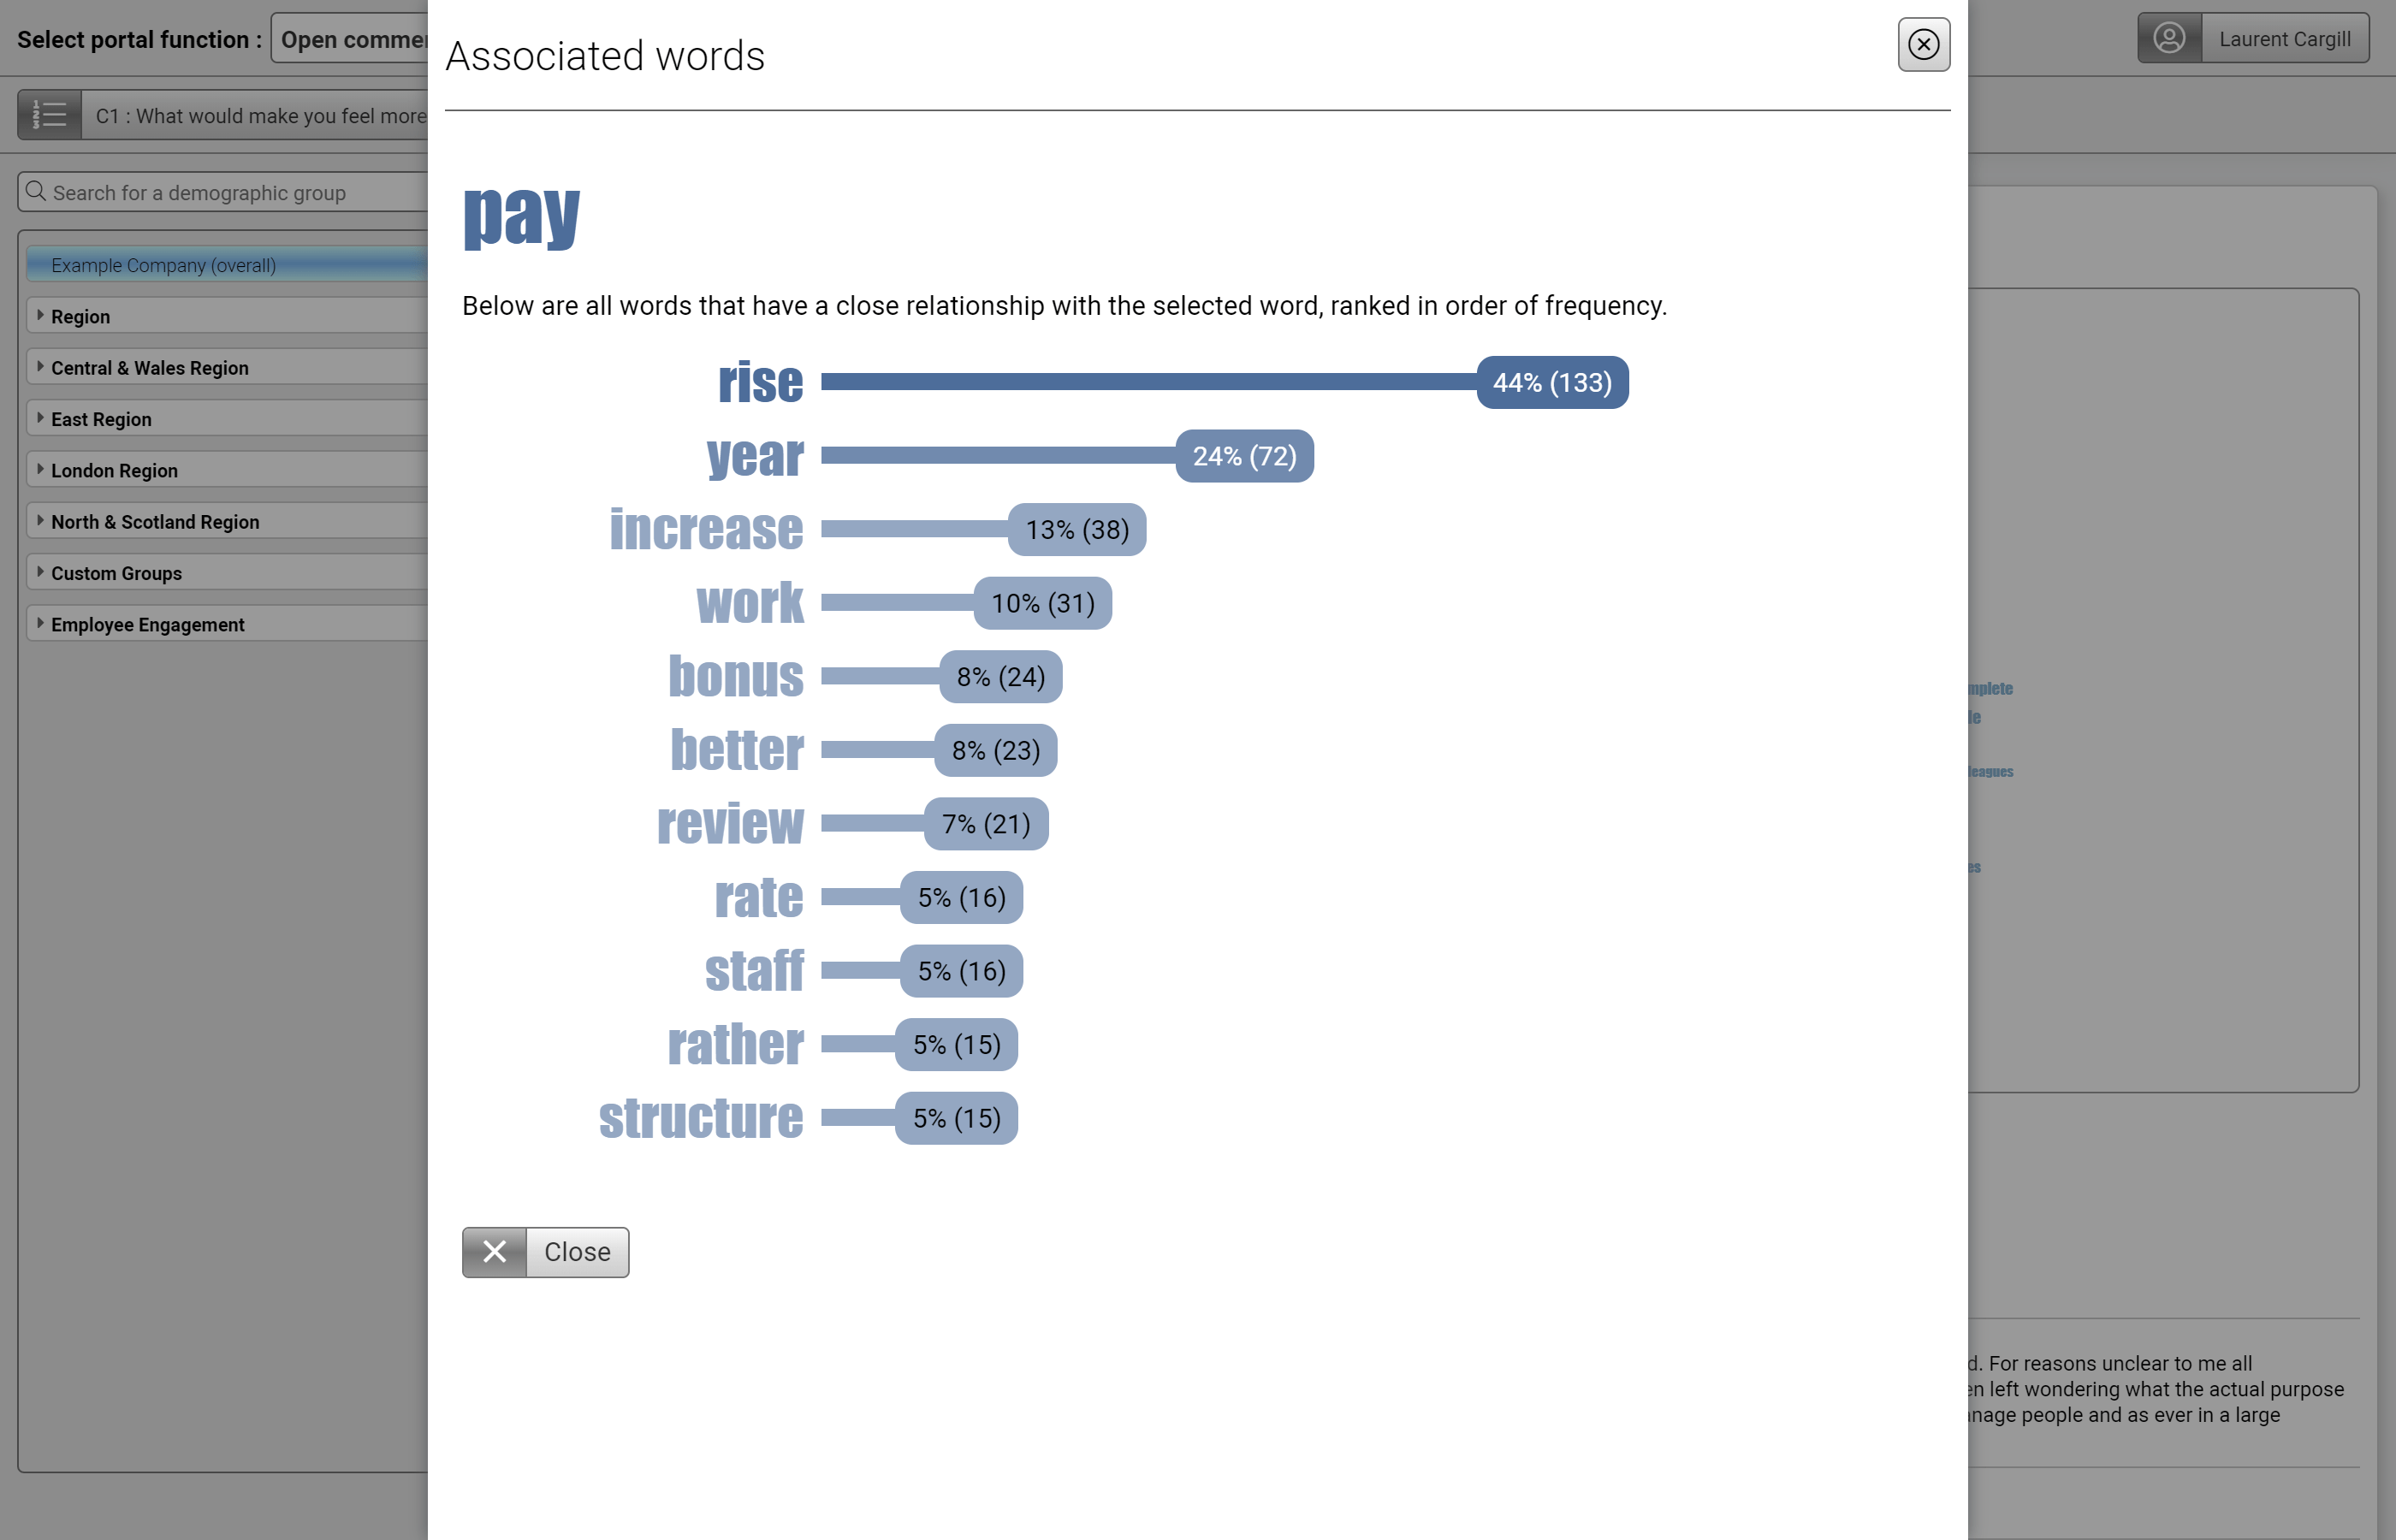
Open comments analysis
You can quickly see key relationships between common words and phrases.
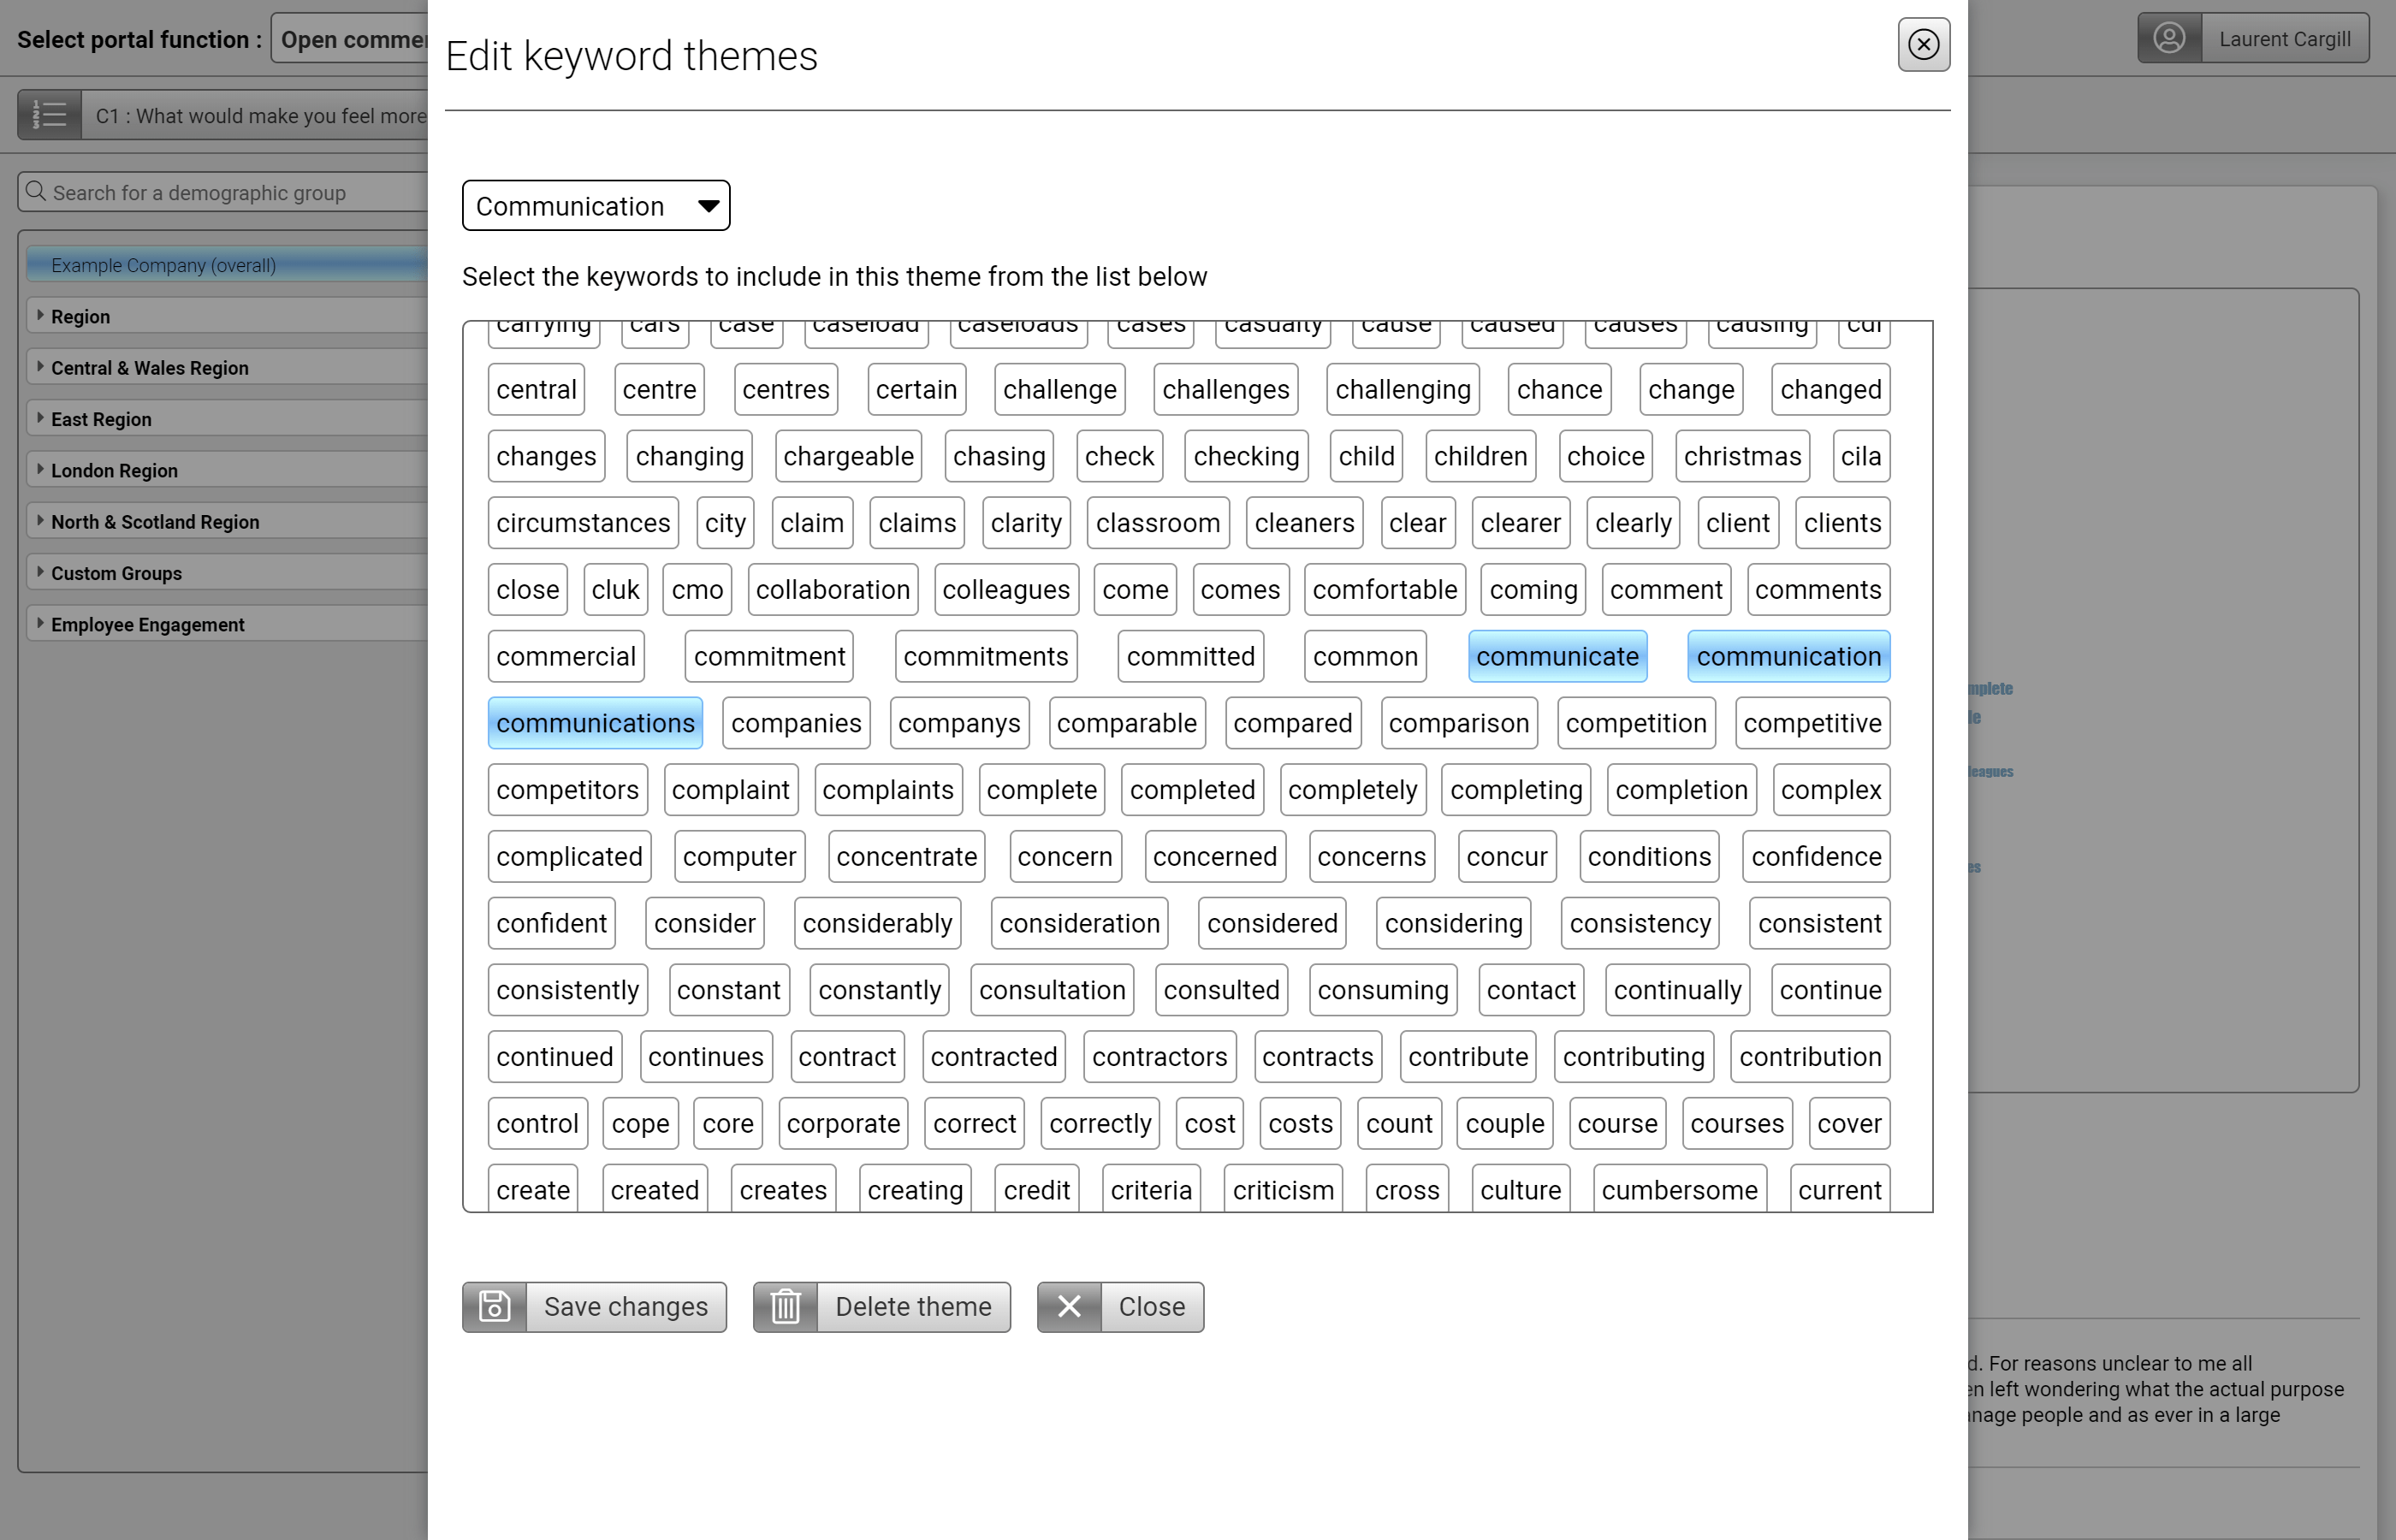
Open comments analysis
Start to categorise your open comments by using the pre-loaded Positive and Negative keywords and creating your own themes.
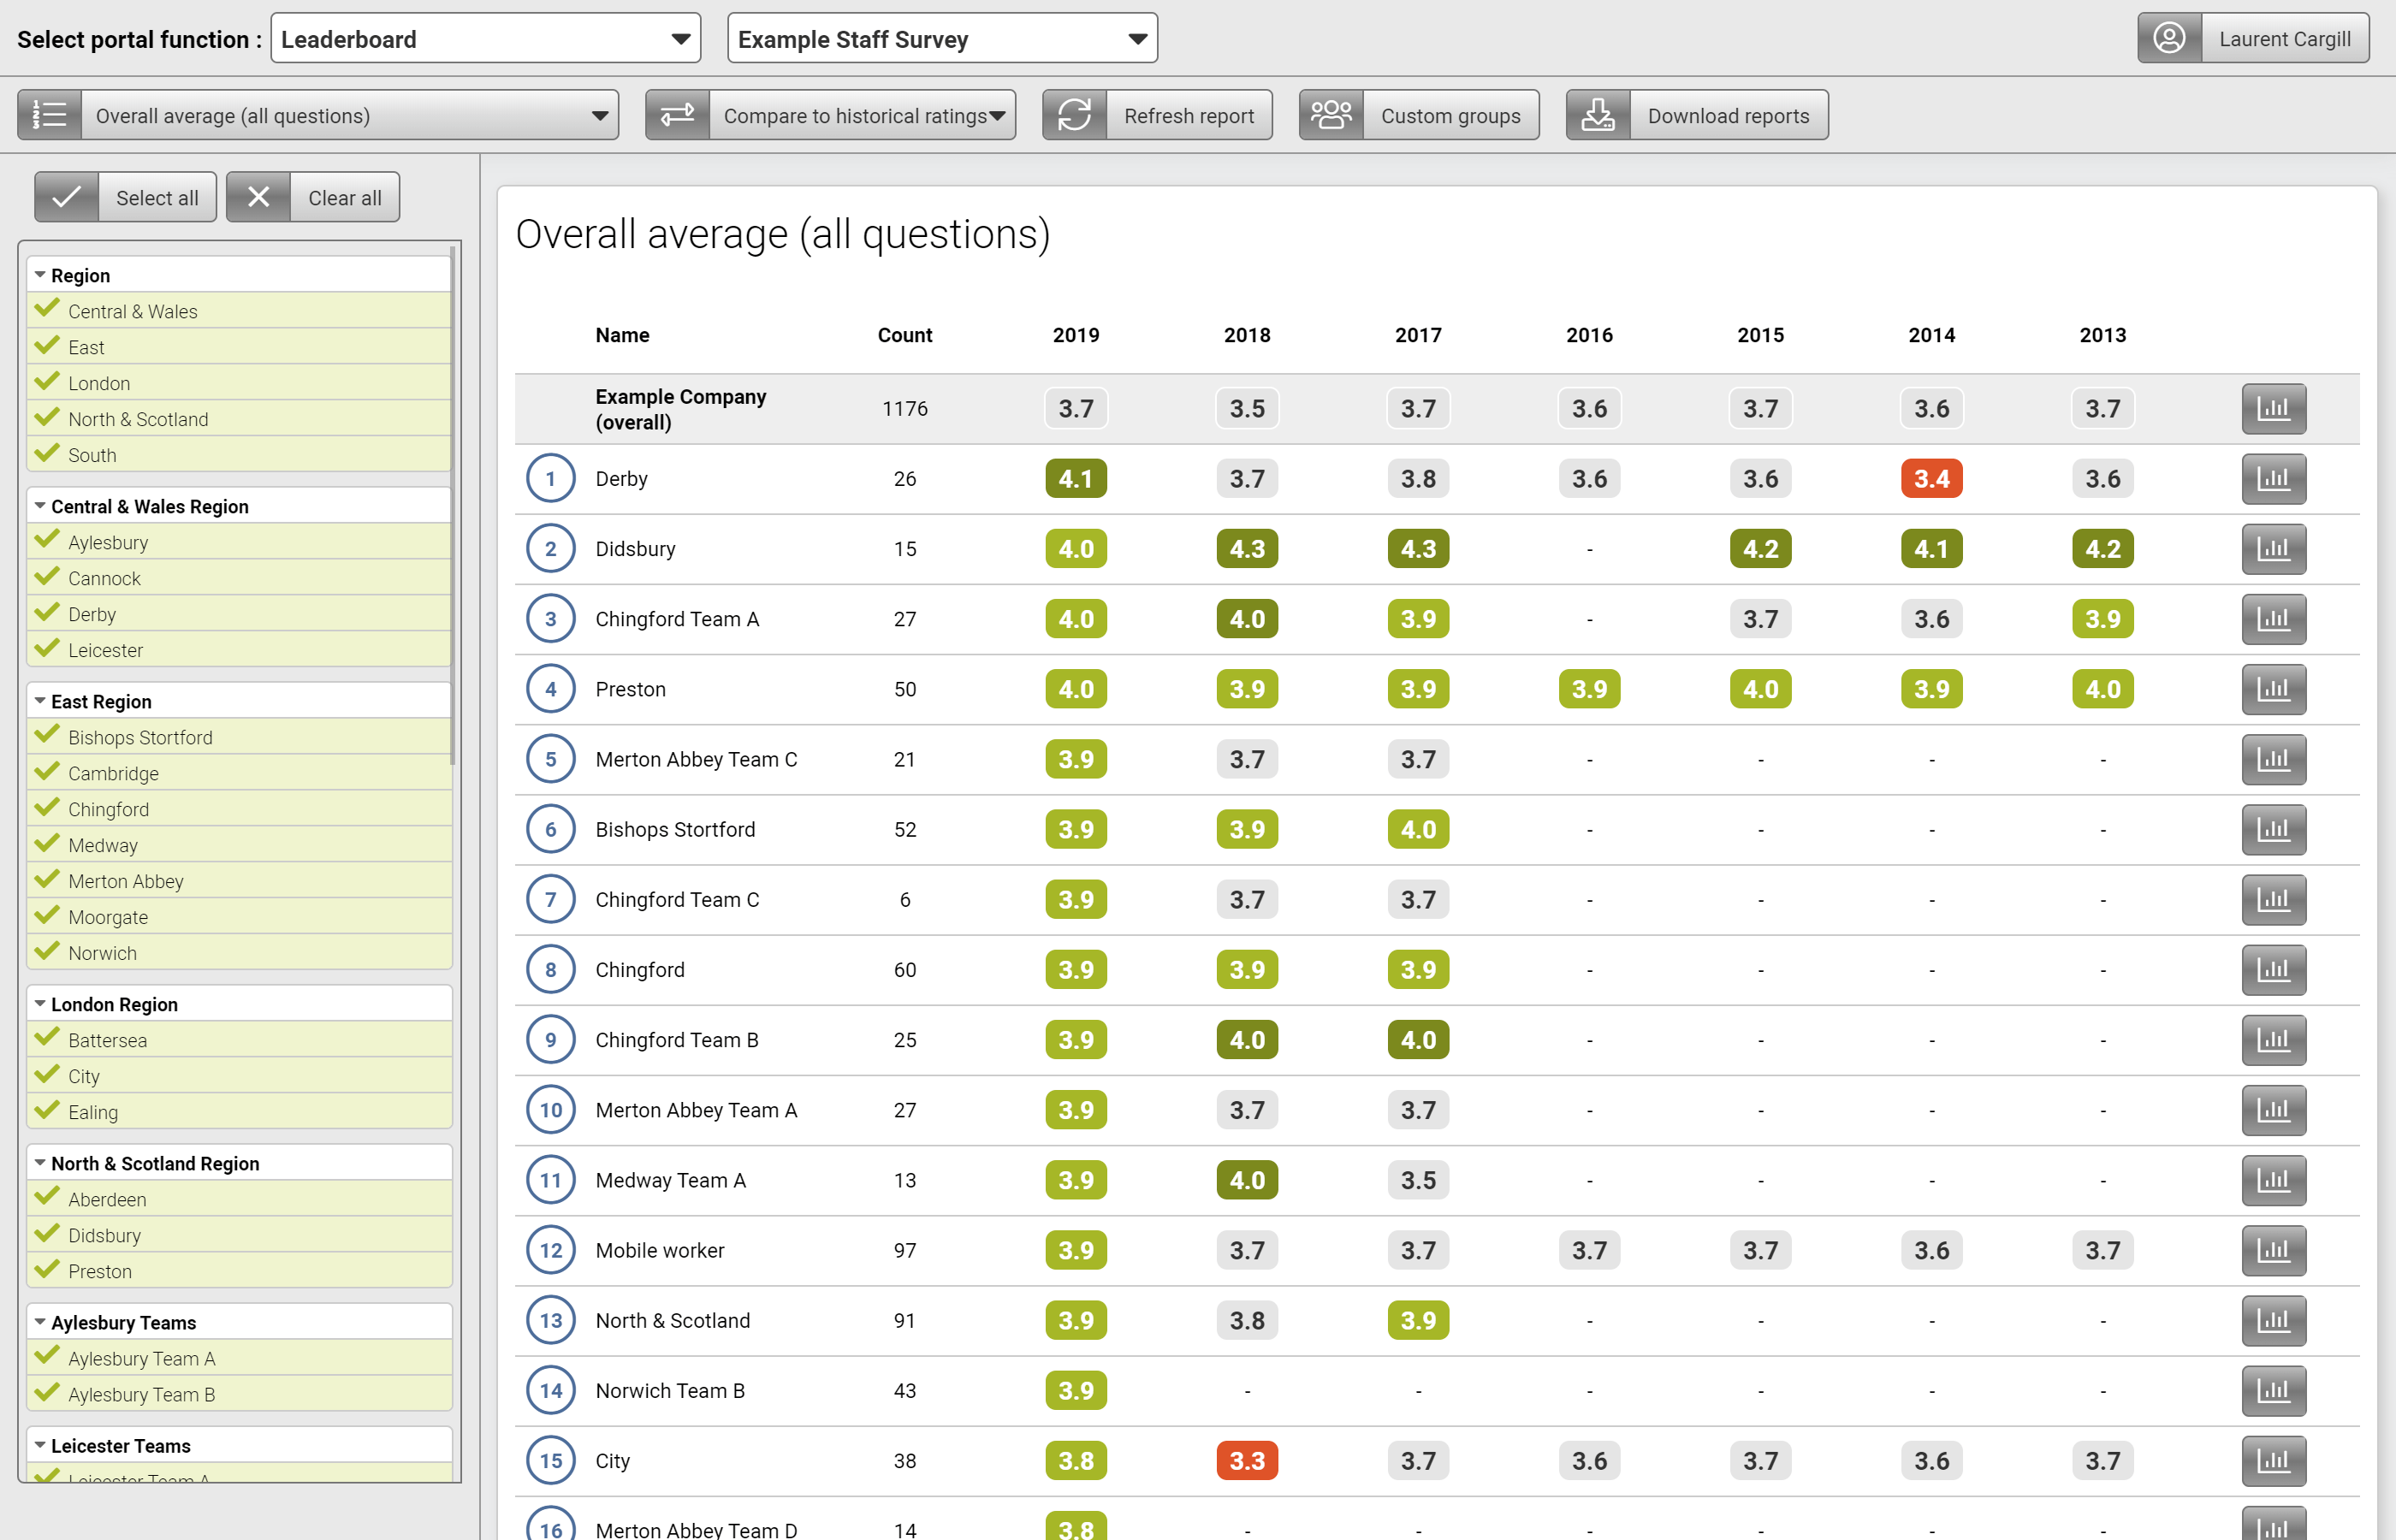
Leaderboard
’Leaderboard’ allows you to rank groups of your respondents according to rating achieved for a specific question and internally benchmark groups against each other. Easy to identify areas of best practice and spot where improvement is required.
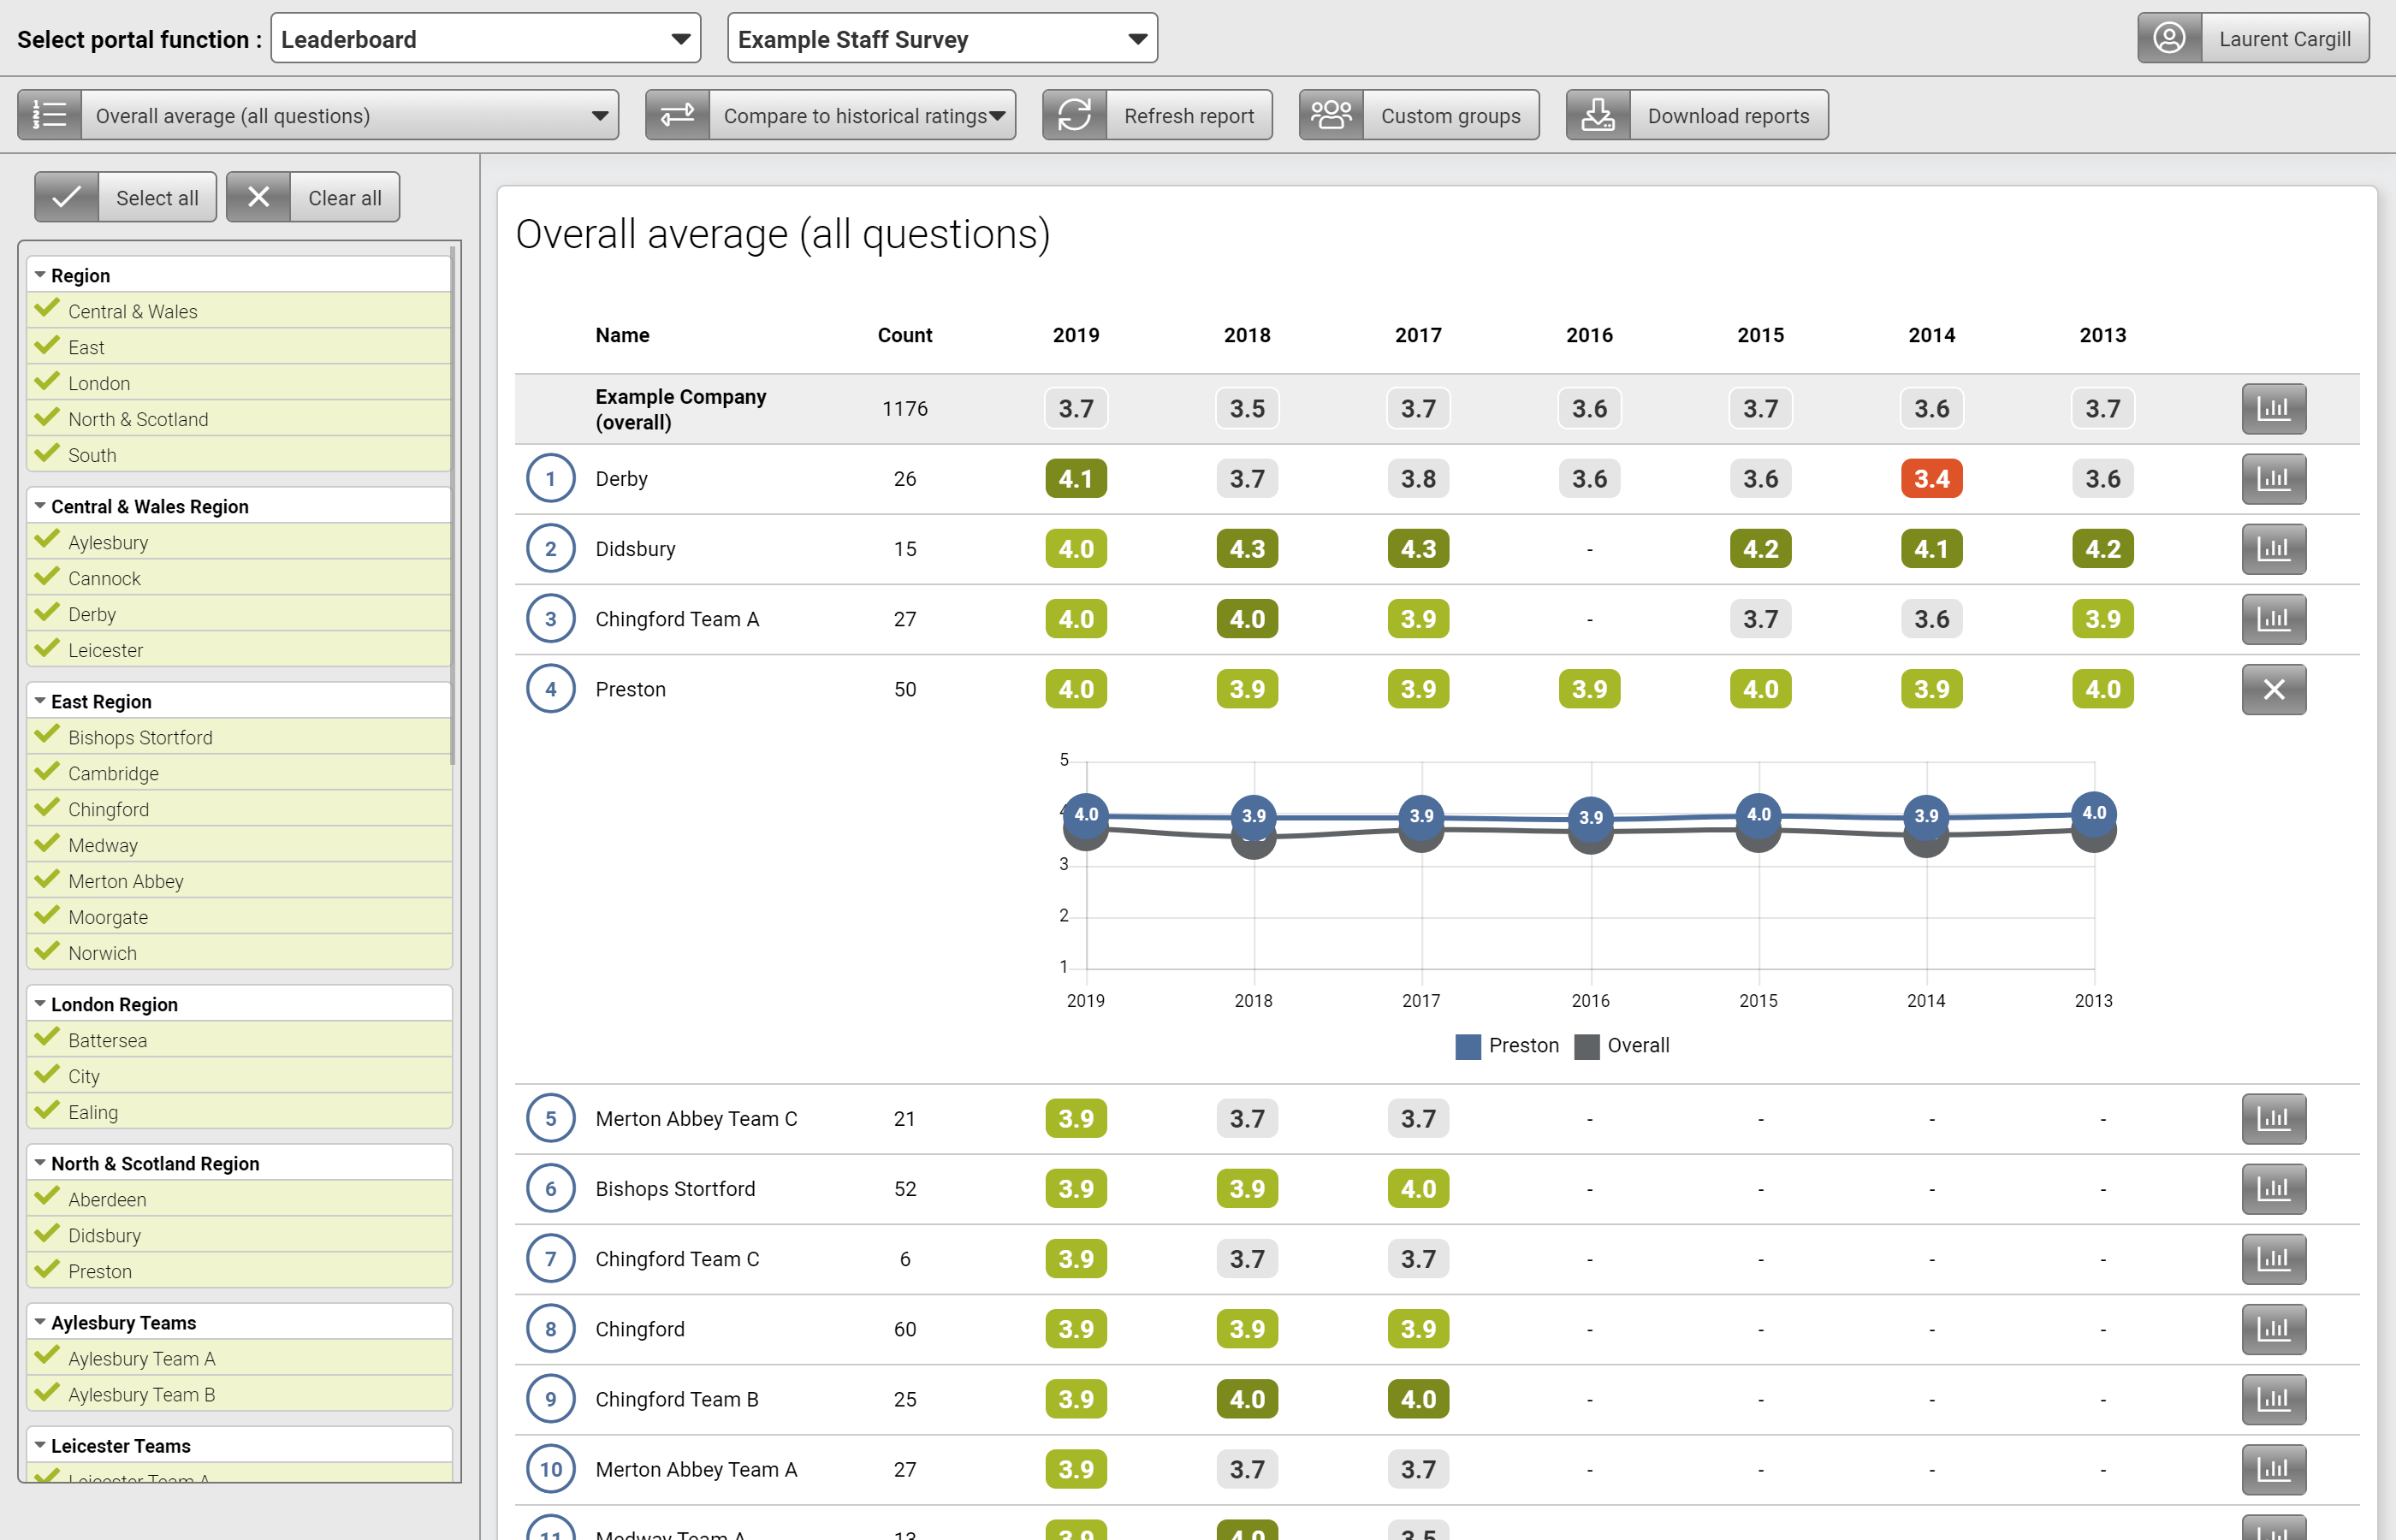
Leaderboard
Visualise the trends over time across all historical surveys
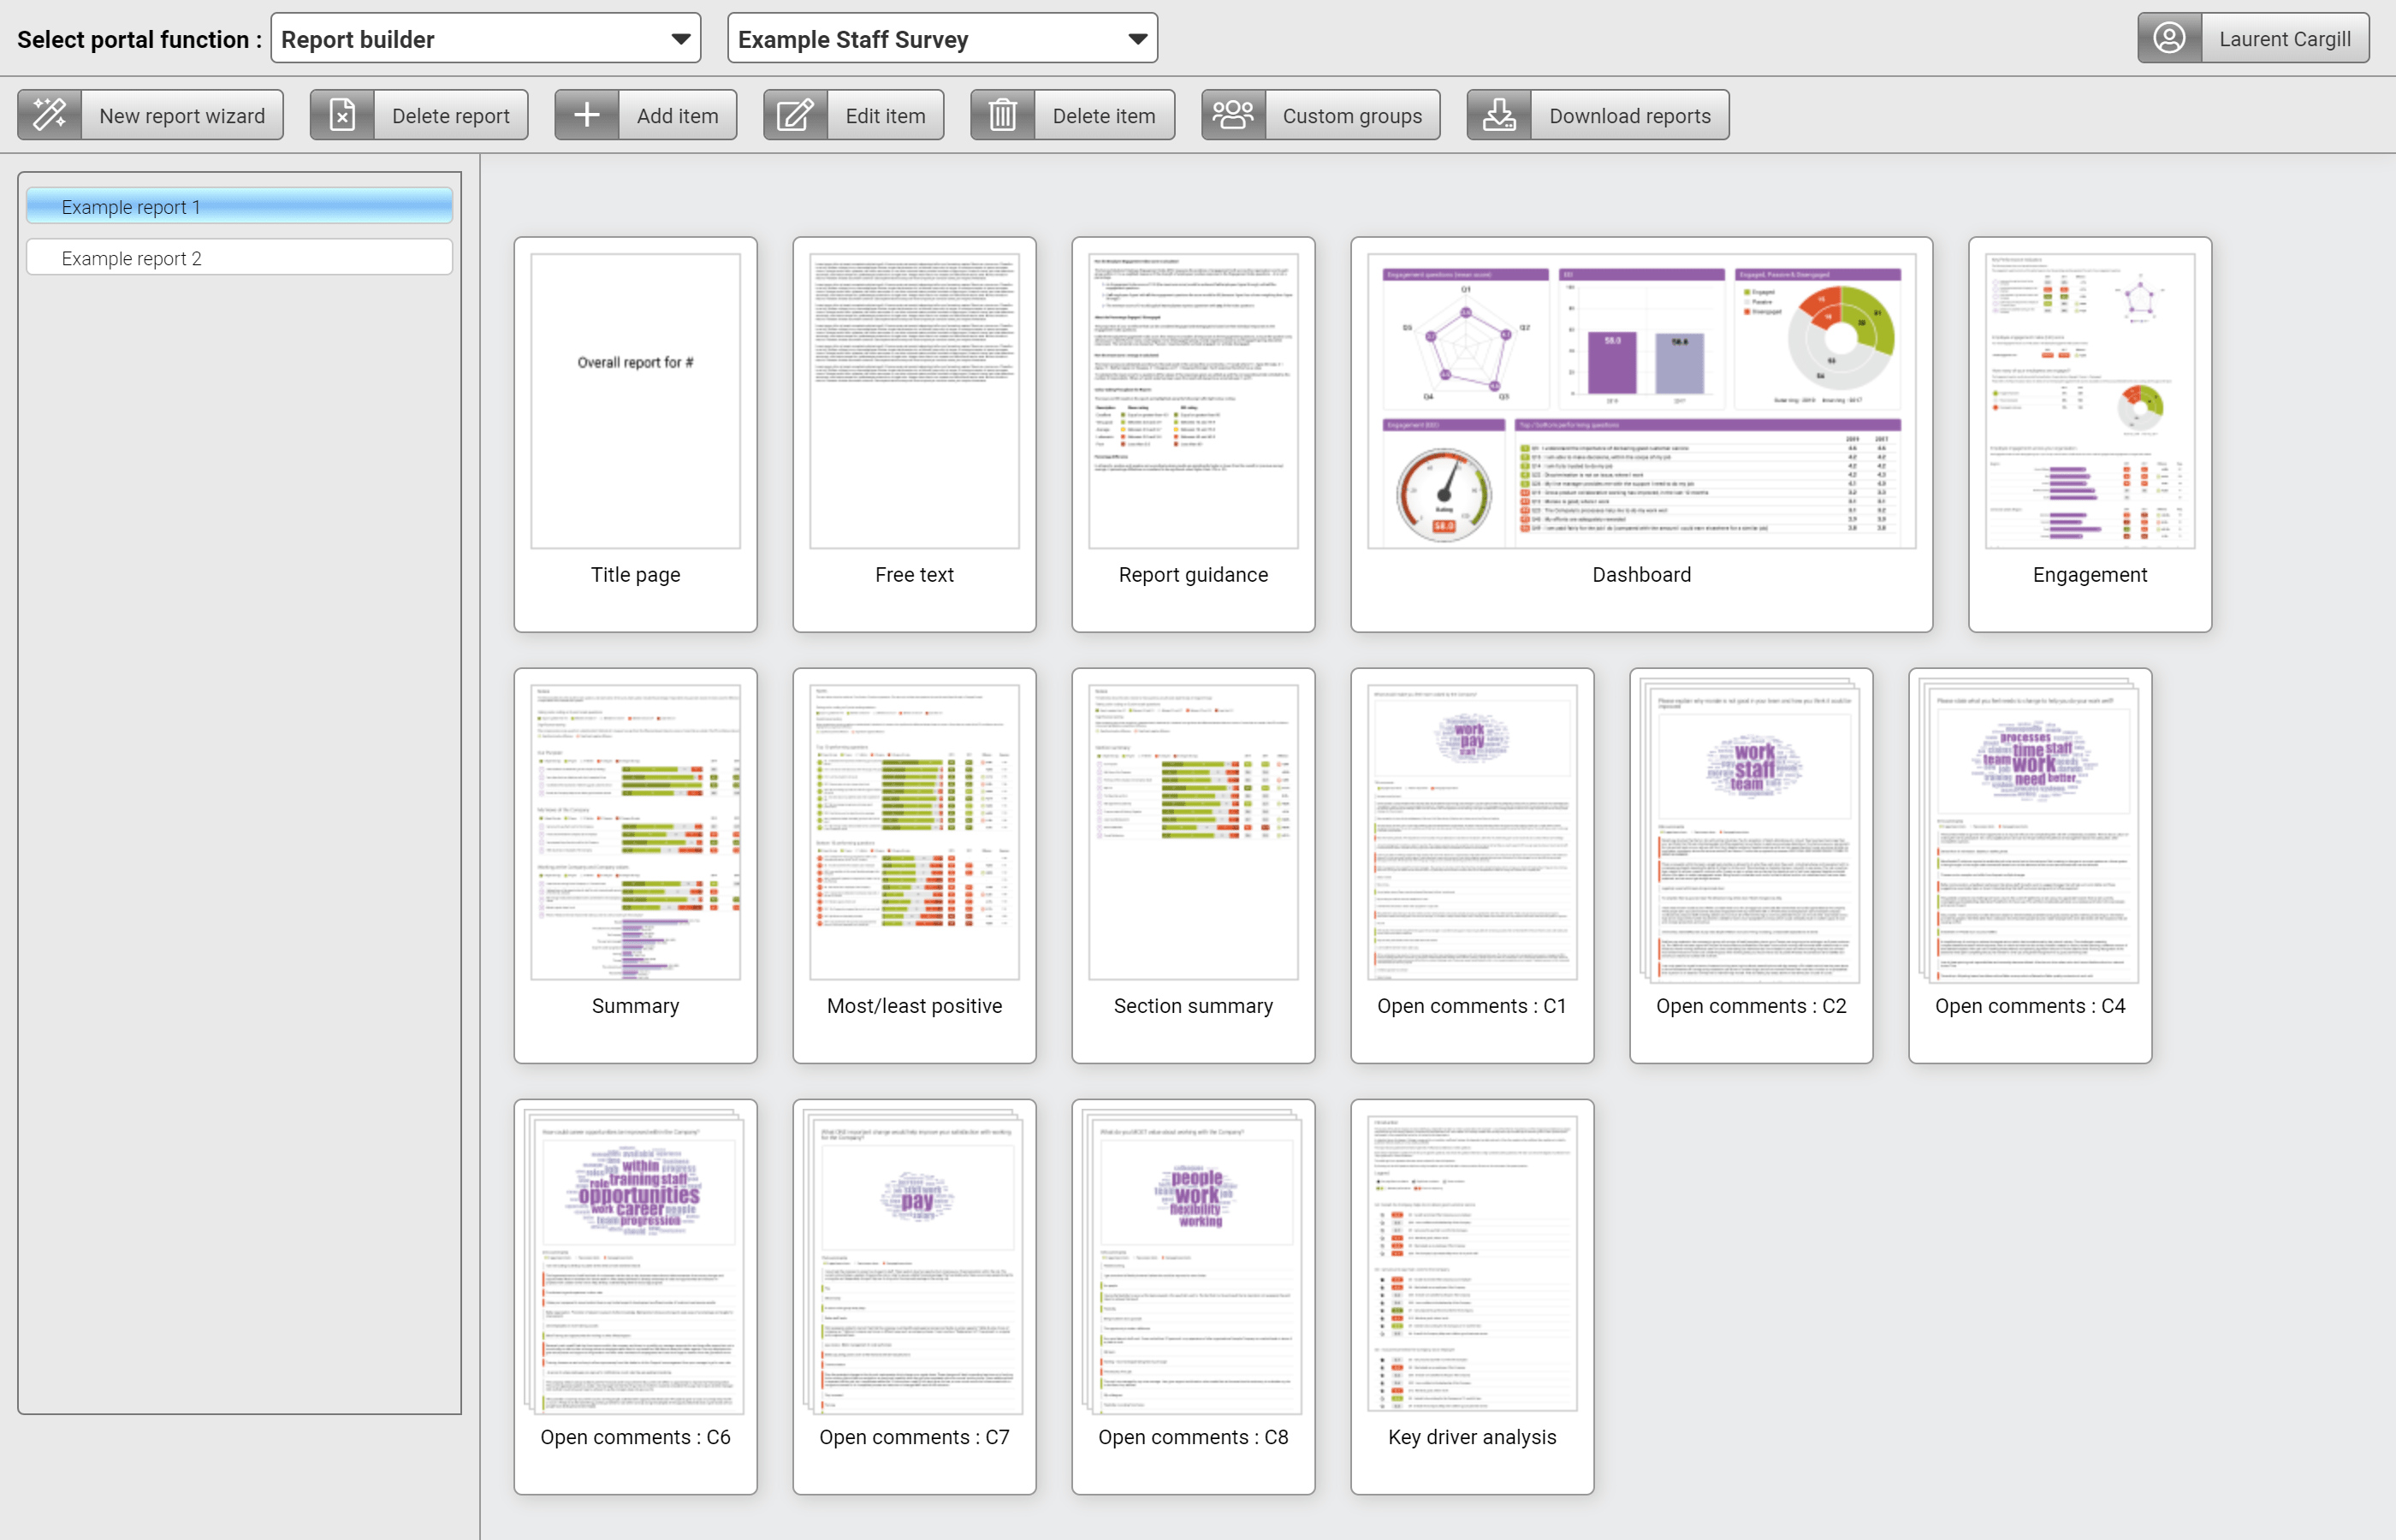
Report builder
Create bespoke compiled reports, pulling together a variety of report types from the portal to create a reporting pack for each group within your organisation.
Compiled reports can be easily exported for all groups within your organisation, allowing you to quickly and easily generate reporting packs
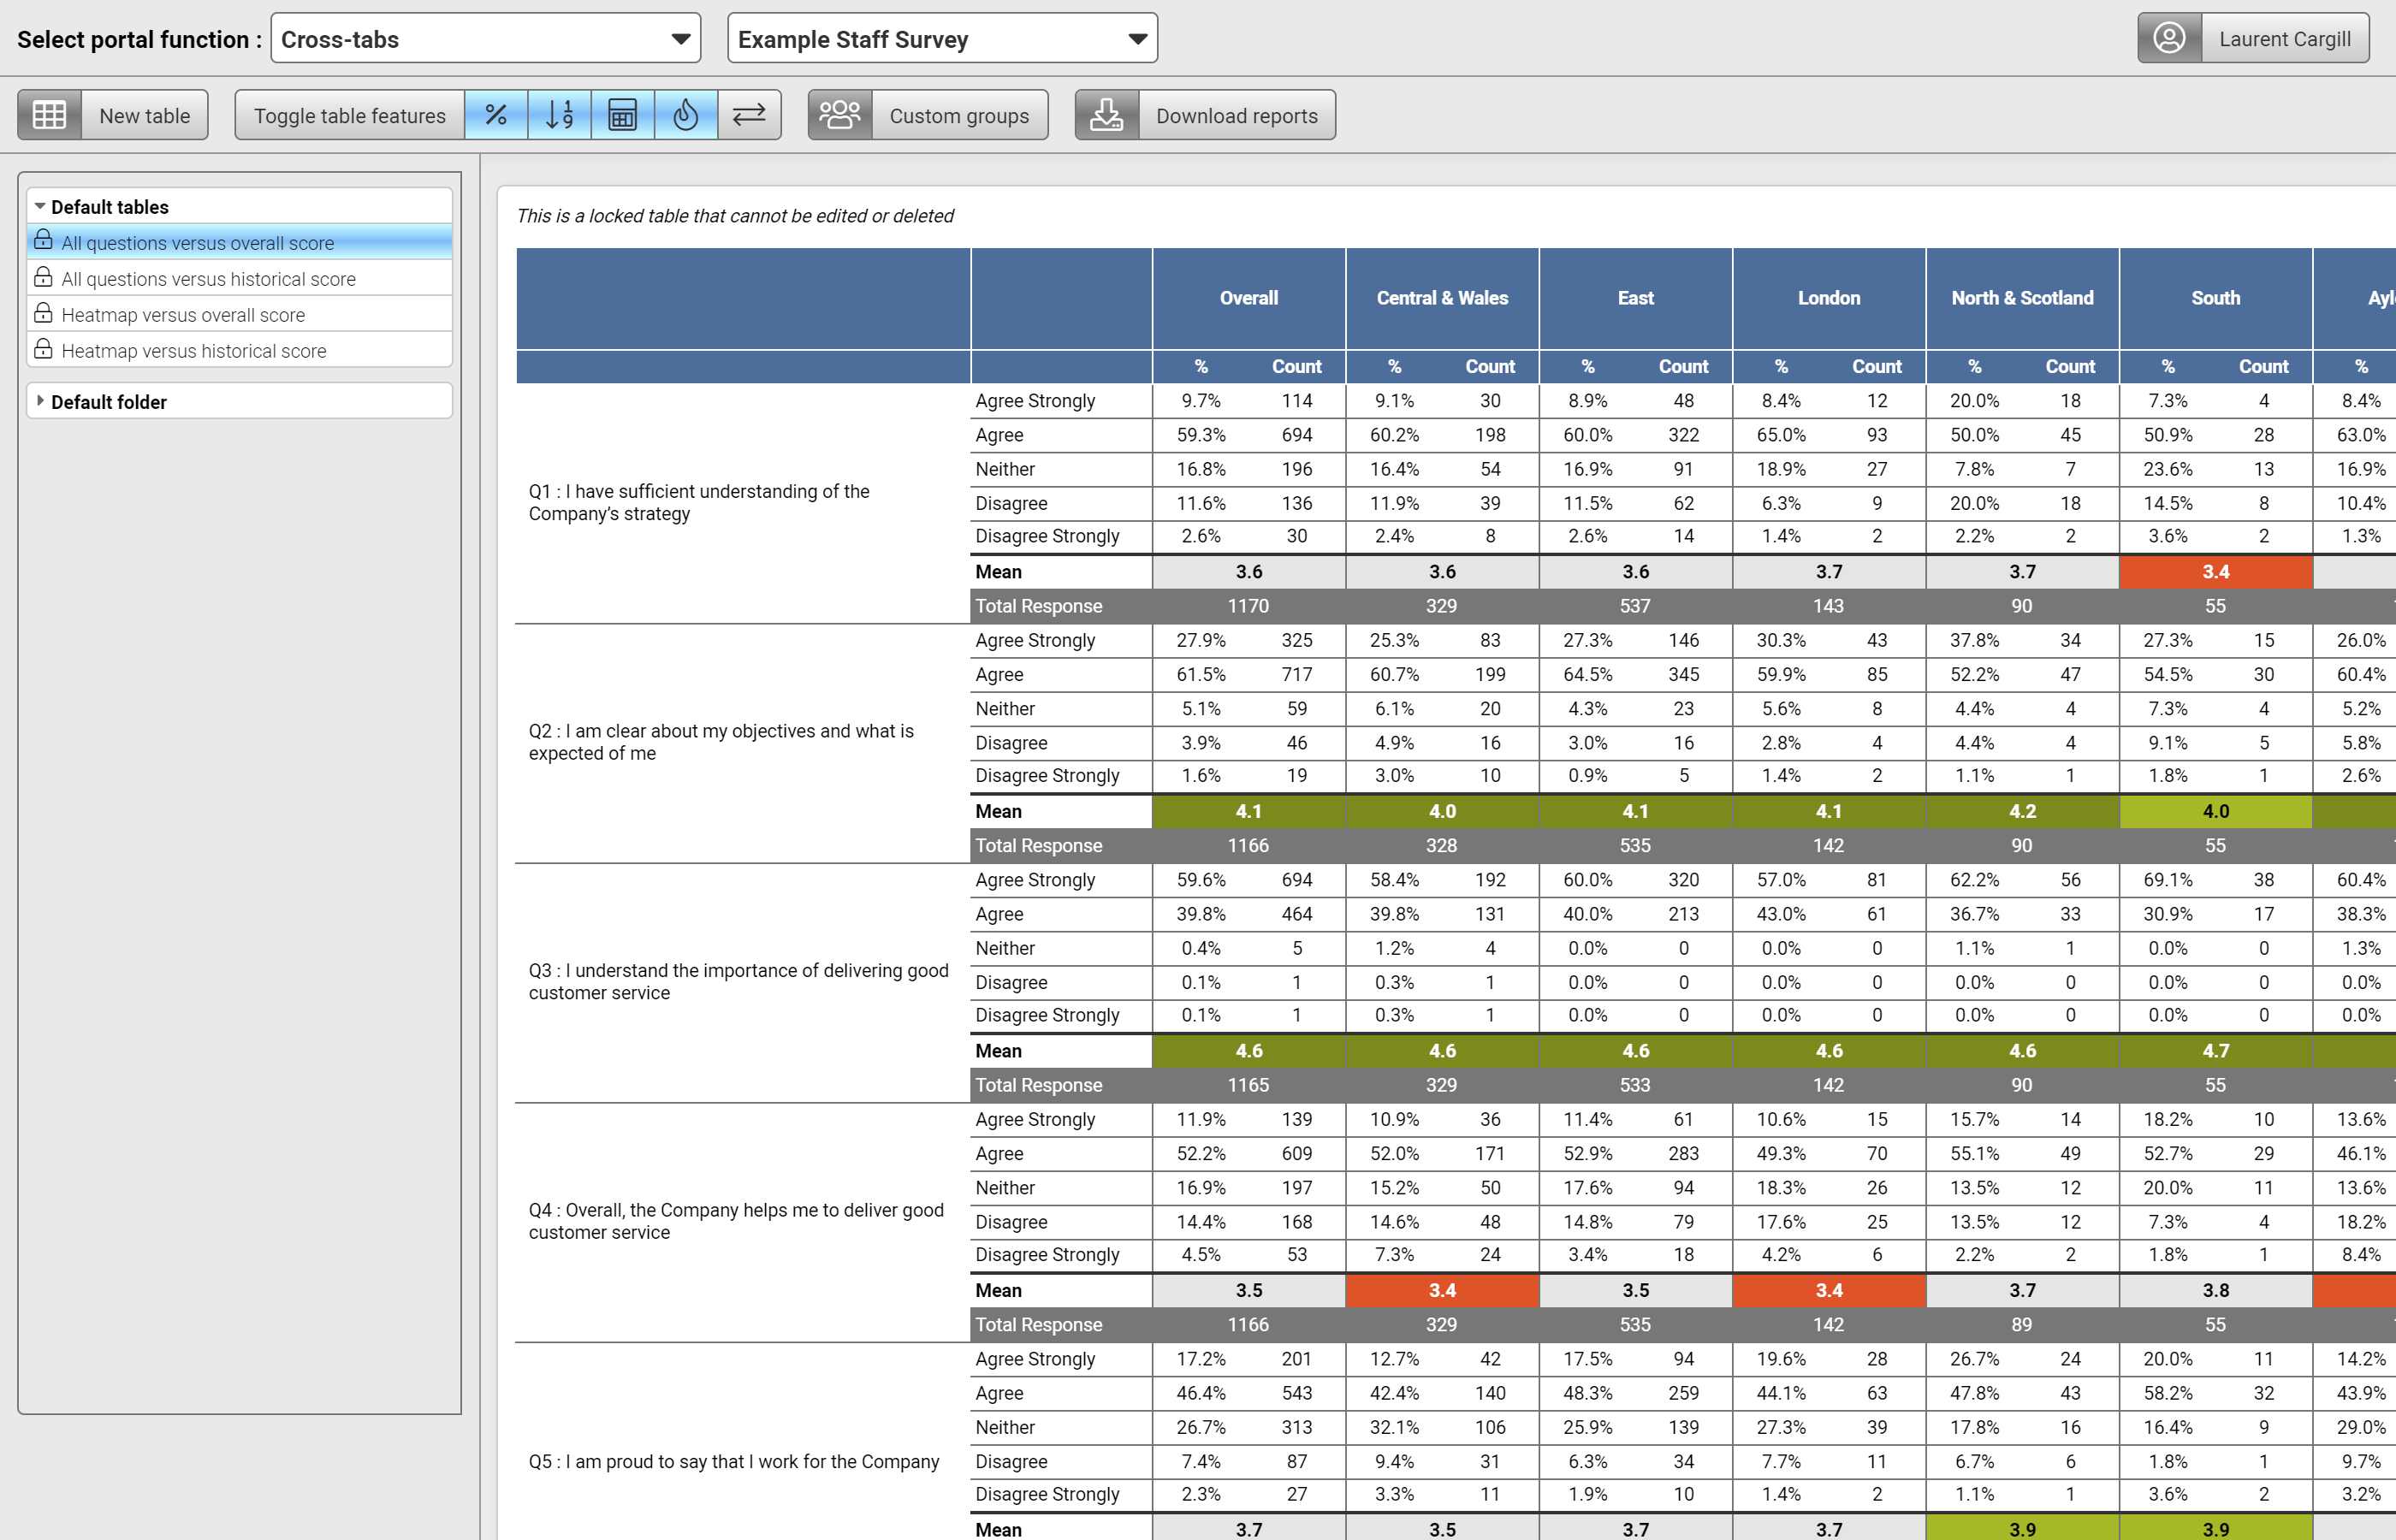
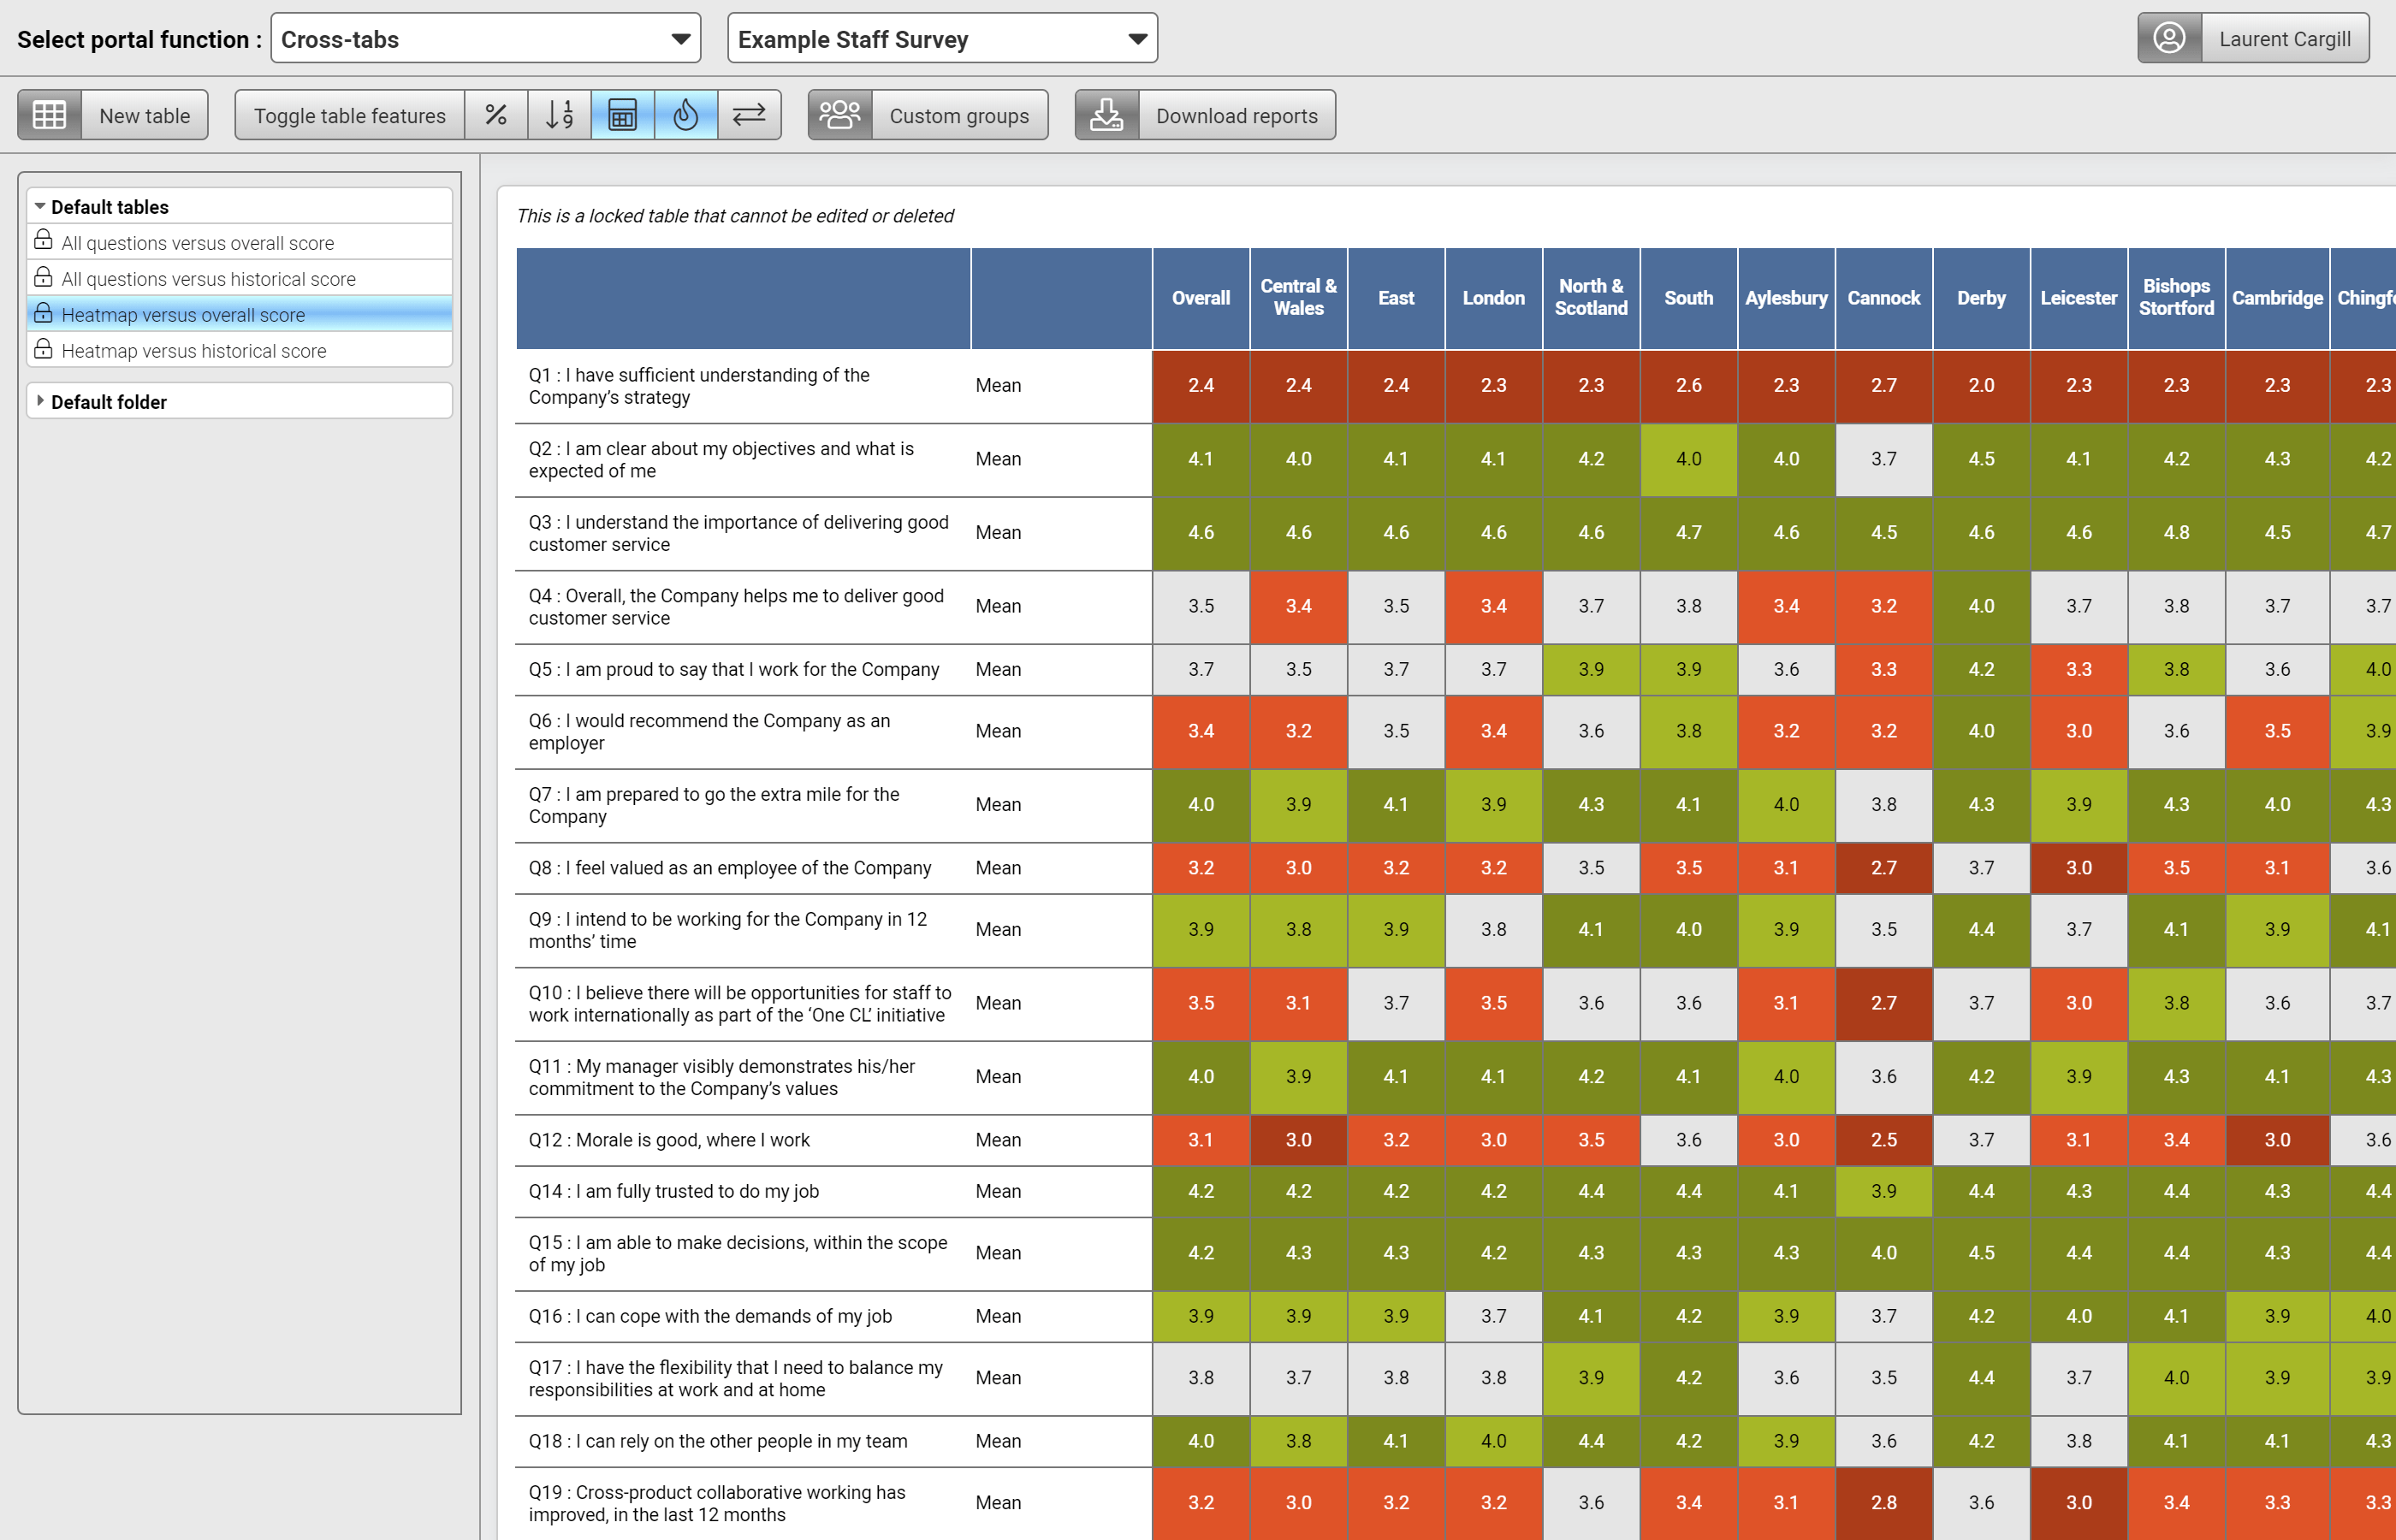
Cross-tabs
Interrogate and dig deeper into your data using ‘Cross-tabs’, creating your own tables of data which can be exported to Excel for further use.
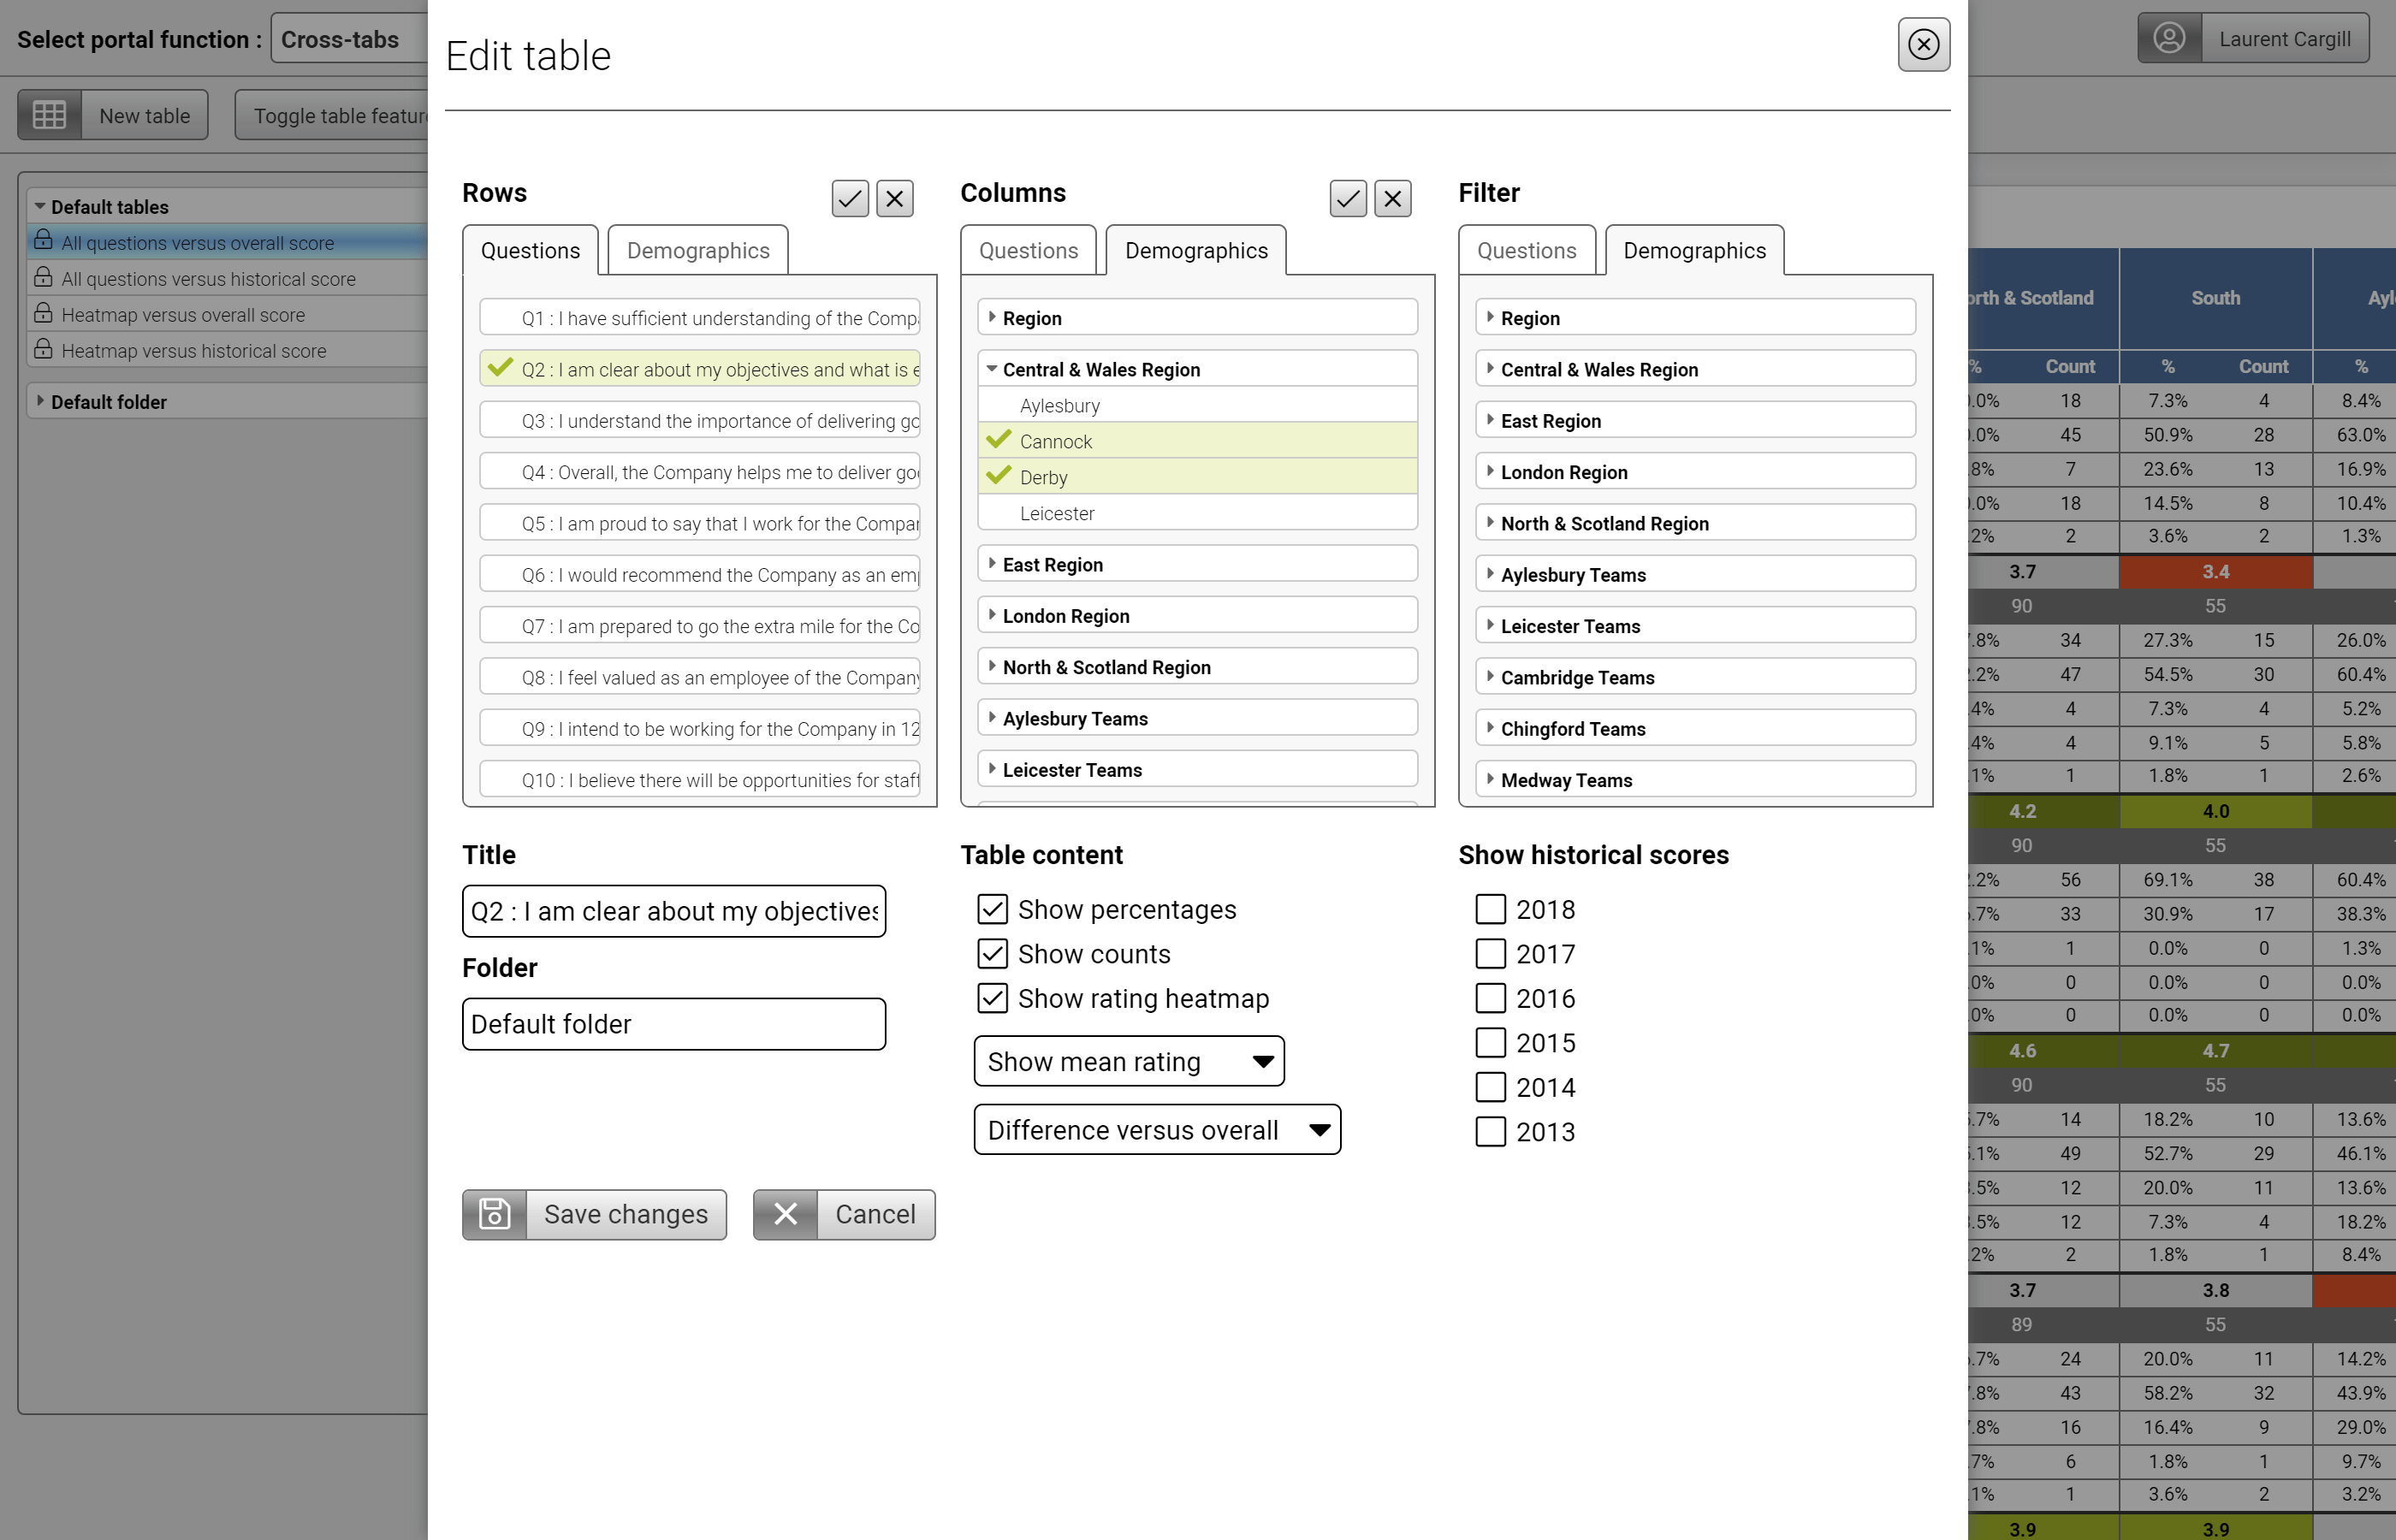
Cross-tabs
Cross-tabulations can be created easily, showing the results for questions split by selected demographics.
Cross-tabs
Features such as colour coding can be applied to highlight areas of good and poor performance.
All of the tables that are created can be exported to Excel.